This site is no longer updated
Please use the links in the sidebar to visit the new sites!
Showing posts with label Nationality. Show all posts
Friday, 17 April 2015
Tuesday, 7 April 2015
Westminster 2015 : The Key Issues in Wales
By OwenTuesday, April 07, 2015Barnett, Borders, Disability, Election 2015, EmpSk, Energy, EU, Fiscal Policy, Housing, Merthyr, Nationality, Policing, Powers, Powys, Scotland, Silk, Vale, Waste, Welfare, YPeopView Comments
![]() |
| What are likely to be the main issues for Welsh voters? (Pic : Click on Wales) |
The first debate's out of the way, I've given my verdict on the Coalition and the manifestos are going to be released over the next few weeks (I'll look at them in more detail once their all out, though UKIP are dragging their heels by the looks of it) - which means it's time to focus on some of the issues that might be fought over in Wales.
Sunday, 20 April 2014
500th Post : The Sliding Scale of Nationalism
By OwenSunday, April 20, 2014Cons, Constitution, Greens, Iaith Gymraeg, Independence, Labour, Lib Dems, Nationalism, Nationality, Northern Ireland, Plaid, Scotland, UKIP, UnionismView Comments
I've reached an important milestone
today - the heady heights of 500 blogs.
I'd like to thank everyone who's read or scanned over my ramblings for the last three years. I might make it look easy, but it's hard work - often miserable, sometimes fun – but always rewarding. Taking time to read it means a lot and I hope I can continue to count on your support for however long this blog continues. Diolch yn fawr iawn i chi.
To "celebrate", I'm going to do what I usually do and over-analyse an abstract topic.
There's been some discussion on here, and for many years elsewhere, about different strands of nationalism. Some people in Plaid Cymru, for example, don't support independence. Meanwhile, people who I would consider hardcore unionists have been tarred with the "nationalist" brush simply for backing Silk Commission recommendations.
In the light of a high-profile Twitter row involving the Welsh rugby captain, it's fair to say there's little understanding of other people's points of view and how they might form their opinion on the matter.
A person's relationship with a nation can change based across a range of different factors. In my opinion, there are three broad identities that engender a sense of nationalism.
I'd like to thank everyone who's read or scanned over my ramblings for the last three years. I might make it look easy, but it's hard work - often miserable, sometimes fun – but always rewarding. Taking time to read it means a lot and I hope I can continue to count on your support for however long this blog continues. Diolch yn fawr iawn i chi.
To "celebrate", I'm going to do what I usually do and over-analyse an abstract topic.
There's been some discussion on here, and for many years elsewhere, about different strands of nationalism. Some people in Plaid Cymru, for example, don't support independence. Meanwhile, people who I would consider hardcore unionists have been tarred with the "nationalist" brush simply for backing Silk Commission recommendations.
In the light of a high-profile Twitter row involving the Welsh rugby captain, it's fair to say there's little understanding of other people's points of view and how they might form their opinion on the matter.
A person's relationship with a nation can change based across a range of different factors. In my opinion, there are three broad identities that engender a sense of nationalism.
- National Identity : The stomach – This is the primal, visual manifestation of nationalism. It's a "gut instinct" where you define who and what you are, and the visible outward label. This could also be expanded to include ethnic identity too. This asks the question, "Who am I?"
- Cultural Identity : The heart – This is the more fluid, dainty identity by expressing what you feel about the nation you belong to, trying to figure out how to express that, and trying to determine what being Welsh/British/English represents. This asks the question, "What does it mean?"
- Political Identity : The head – The rational, thinking side of it. This determines how you express nationalism based on decision-making, policy and democracy. It determines how far you're willing to go in terms of self-determination and how the nation fits into that. This asks the question, "How does it work?"
In trying to determine what all this actually looks like, I've come up with a sort of Kinsey Scale of nationalist sentiment for each of them, based on two poles - Welsh & British nationalism. It's worth pointing out that there are no "right" or "wrong" answers here.
National Identity
![]() |
| (Click to enlarge) |
The results clearly showed that a majority of people in Wales consider themselves exclusively Welsh with no British identity whatsoever. This sentiment was stronger in some parts of Wales than others – in particular the south Wales Valleys.
People who consider themselves Welsh & British are in a withered minority. In fact, more people in Wales consider themselves English-only (11.2%) than Welsh & British. It seems most people have a very firm idea of what their national identity is : Welsh, English or British – not a mix.
You would think, therefore, that the fortunes of nationalist politics in Wales would be much better than they are currently.
Clearly, national identity isn't that important in political terms. It's been successfully adopted by all of the main political parties in Wales to such an extent that it's become rather elastic, or is being used as a dog whistle when it suits their ends – as we saw recently with Welsh Labour's claims of a Tory "War on Wales".
It can be a successful tactic too, as playing to national identity illicits a primal, somewhat territorial, response in voters and public. As a living embodiment of Welsh self-determination, many of us probably will defend politicians - and devolution as an institution - if there's any hint of an outside attack that would infringe upon Welsh identity or self-respect.
An exception there would be those who would consider themselves British, and/or have an outward antipathy towards all forms of Welshness.
The real nuanced layers of nationalism and its outward expression perhaps lie in cultural identity.
Cultural Identity
![]() |
| (Click to enlarge) |
Although culture and nationality are inextricably linked, they needn't be symbiotic. You can measure national identity in the census, and you can measure its political expression in voting intentions. Cultural nationality is very hard to quantify.
So, how can you tell if you're culturally Welsh, culturally British, or a mix of both? I suppose it's what's in your heart. If you feel Welsh you are Welsh, likewise with British. If you're comfortable with both – so be it.
The outward signs of a person's cultural identity involve those things outside the formality of national identity, ethnicity or voting. That includes : attitudes towards the Welsh language, sports, literature, arts, hobbies and media consumption habits.
Those at either end of the scale are more romantic in their cultural identity. They probably get a sentimental glint in their eye thinking of traditions and are highly involved in cultural affairs of their chosen identity. They're proud of what they are, and aren't afraid to tell the world. When that level of patriotism turns unpleasant it becomes chauvinism.
The next step down would be those who are very firm in their cultural identity. On the Welsh side, they might speak Welsh or really enjoy things like Welsh literature and Welsh music but aren't obsessive about it and are a bit more flexible.
Likewise, anyone considering themselves "culturally British" will still have to accept all of Welsh culture – including the language – as a part of that identity. British culture without the Welsh bits isn't "Britishness" but "Englishness" because it rejects a key part of what makes "Britain" Britain.
Then there are those with a more fluid cultural identity, but with a clear preference for one. On the Welsh side they would be "Ninety Minute Nationalists". I've come up with "Olympic Unionists" for a British equivalent as I couldn't think of anything better.
Someone supporting Wales at the Six Nations, or the Welsh national football team, is 100% Welsh for ninety minutes. Even an ardent Unionist is advocating Welsh independence by supporting the Welsh national side - which by most normal conventions of international sport shouldn't even exist.
However, once the game is over, their Welshness disappears and they don't think about it too much.
That's why "Ninety Minute Nationalist" is adopted as a pejorative. To the hard nationalist, the position is nonsensical, as Welsh culture should be – and is – linked not only to national identity, but political nationalism. To use footballing terms, 90 minute nationalists are seen as glory hunters and armchair fans, while nationalists are season ticket holders and will question anyone not seen to be pulling their weight. Similarly, from the opposite end, hardcore royalists might have similar suspicions of of Celtic republicans.
Things become a lot more complicated when you come to ethnic minorities, who are cited as feeling more British than white ethnicities, despite coming from cultures and backgrounds which are very different and contribute to the "melting pot" of Welsh and British society. Ethnic minorities might see adopting "Britishness" as a safer option, as Englishness in England has been claimed by the far-right - though that's starting to change.
![]() |
| Even the most ardent unionist can support Welsh independence for 90 minutes - plus time to chug a beer or two. (Pic : City School of Languages) |
Being stuck in the middle might be a sign of cultural apathy and no real strong connection to either pole than a cultural identity in itself.
I was born in a former colony, have an Irish surname, support an English football team, haven't read much Welsh literature and most of my favourite authors and books are American. I don't speak much Welsh and I've listen to more Norwegian and German music.
In cultural terms, I should be about as British as they come or don't have a cultural identity at all, placing me somewhere slap bang in the middle. Based on that alone I probably have more in common with the Lib Dems and Greens than Plaid Cymru.
Yet I'm still one of the more prominent hard nationalists and supporters of Welsh independence out there. I can only relate to this from my own anecdotal experiences, but far from nationalism being solely about identity issues, it clearly goes a lot, lot deeper.
You can like British culture and still be a Welsh nationalist. Likewise, you can even live and breathe Wales in everything you do and still be a British nationalist. Look at the some of the Tories.
Political Ideology & The Constitution
![]() |
| (Click to enlarge) |
I suppose this is the meat when it comes to nationalism and national identity. It mostly manifests itself as support (or lack of) for varying levels of self-determination, without which a nation can't exist.
At either end, you're going to have the fanatical nationalists - people who are exclusively and stridently Welsh or British. On the Welsh side, they'd support independence by any means necessary, and completely reject Britishness. On the British side, they'll show an antagonism towards any outward sign of "Welshness" and would equally support the union by any means necessary. You're talking Northern Irish paramilitary groups, historical figures like Owain Glyndwr and protest organisations. So they're thin on the ground, if they even exist at all in modern Wales.
A step down from that at either end would be those who support Welsh independence on both an ethnic and civic basis, and those who oppose all forms of devolution – but would stop short of violent direct action, just be very, very vocal about it.
There are differences between between ethnic and civic nationalism . The former is generally seen as more right-wing because it links blood to soil, while the latter is bog-standard social democracy with extra flags, and has pretty much been adopted by all the main parties in Wales to varying degrees.
I probably count as an "8" – a civic nationalist who supports independence more strongly than mainstream opinion and perhaps stronger than Plaid Cymru. Such people are often called "hard/dry nationalists".
The vast, vast majority of people will fall somewhere in the middle. This includes those who are civic nationalists but don't support independence strongly (Plaid Cymru in general). Also, "wet nationalist" Home Rulers who support further devolution or a form of federalism and consider themselves happy to be Welsh – this would include the likes of David Melding AM (Con, South Wales Central).
Welsh Labour are arguably slap bang in the middle – they're happy with devolution as it is, and are open to more powers, but would fall short of federalism, considering themselves both "Welsh & British". Yet, as the census figures paradoxically show, being "Welsh & British" is something of a minority thing and enjoys less support than Welsh independence. So playing up dual-identity is unlikely to win support on its own. It looks like, quite frankly, nobody cares if they're Welsh or British when it comes to politics, unless they're already a nationalist.
Also lurking are the devo-sceptics (or devo-realists), who think devolution has gone far enough. They perhaps consider themselves more British than Welsh (but will play up the Welshness when it suits them) and would likely oppose further powers, but not the principle of limited self-determination as a compromise. I'd image the Conservative grass roots would be found here, as would many Old Labour and Labour MPs.
![]() |
| (Click on Wales) |
But even within those parties, there are going to be differences. Dafydd Elis-Thomas AM (Plaid, Dwyfor Meirionnydd) is clearly a Lib Dem style "Home Ruler", while UKIP have come around to tolerating the Assembly's existence.
People who consider themselves "internationalists/citizens of the world" might often fall under British nationalism too because they support the status quo by default. The Green Party of EnglandandWales gives the impression of having quite a few of these - and have really struggled to adapt to post-devolution Wales, despite being officially federalist - so are arguably closer to UKIP than Plaid in terms of nationalism, but not general ideology.
Having said all this, it's worth being careful in strictly equating levels of support for independence with nationalism. If there were a Welsh independence referendum tomorrow, with no underlying case along the same lines as Scotland's Future, even I'd vote no. It's one thing to support something superficially, it's another thing entirely to check the details - and there are plenty of details on Welsh independence that need to be ironed out if a realistic case is ever going to be made.
Although it's true that you can't eat a flag, they can make very good tablecloths for a skilled chef.
Nationalists shouldn't get too despondent about low levels of support for independence, as all the foundations are there for a sudden change in opinion given the right circumstances. However, it's off the menu for now and we should perhaps learn to accept it and play the long game. Many hard nationalists might not like the idea of Plaid sidelining independence, but they're broadly right to do so.
Likewise, unionists shouldn't get complacent about high levels of support for the Union, which is perhaps all head and no heart. Technocratic arguments about finance and borders will only get you so far. As the Scottish independence campaign is proving, heads can be turned and the positive case for union is – in some areas - built on sand.
You're going to cause controversy in politics when you try to mix the three identities or try and stamp a single one on people.
One of the most important modern human virtues is tolerance. Tolerating something doesn't mean have to like or accept it. You should just respect that some people are going to have different ideas and values from you. When we can all tolerate something or someone you don't like, without resorting to smears or hyperbole, it's a sign our society is starting to mature and our media along with it.
Saturday, 13 July 2013
Census 2011 : A Changing Bridgend
By OwenSaturday, July 13, 2013Borders, Bridgend, BridgT, Census 2011, Disability, England, EnglishM, EU, FreeMove, Garw, Housing, Iaith Gymraeg, Nationality, Ogwr, PCoed, PorthC, Qualifications, Religion, Universities6 comments
- Census 2011 : What's stunting Welsh?
- Census 2011 : Losing our religion?
- Census 2011 : National Identity & Ethnicity
- Census 2011 : Disability,Carers & Health
- Census 2011 : Qualifications
- Census 2011 : Demographics I – How old is Wales?
- Census 2011 : Demographics II– Its meaning for Wales
- Census 2011 : The Home & Relationships
In this final look at the 2011 census data, I'm
going to look at Bridgend down to ward level to see how the county's
changed between 2001 and 2011. I've used an ONS data table tool to
compile this.
If you have no idea which ward is which, here's a map :
Population & Population Density
The population of Bridgend County rose by ~10,500 between 2001 and 2011, from 128,645 to 139,178. Most of that can be accounted to housing developments. Brackla and Cornelly's population rose by over 1,000 each, while in Bryntirion, Laleston & Merthyr Mawr it rose by a whopping 4,417 – almost certainly due to the Broadlands development – and more than doubling the population of the ward (+102% increase).
Brackla remains the most populous ward overall, with a population of 11,749.
Coity will likely see the biggest increase between 2011 and 2021, with the Parc Derwen development likely to add at least 2,500 people.
Not all wards experienced population rises. The Maesteg and Caerau area, Cefn Glas and Litchard/Pendre areas all lost more than 4% of their populations, with Pendre experiencing the sharpest drop of 11.9%, closely followed by Cefn Glas (-11.8%).
Population of major settlements in Bridgend County
If you have no idea which ward is which, here's a map :
![]() |
| Map of Bridgend Council wards (Click to enlarge) |
Population & Population Density
![]() |
| Change in population 2001-2011 (Click to enlarge) |
![]() |
| Population density per ward in 2011 (Click to enlarge) |
The population of Bridgend County rose by ~10,500 between 2001 and 2011, from 128,645 to 139,178. Most of that can be accounted to housing developments. Brackla and Cornelly's population rose by over 1,000 each, while in Bryntirion, Laleston & Merthyr Mawr it rose by a whopping 4,417 – almost certainly due to the Broadlands development – and more than doubling the population of the ward (+102% increase).
Brackla remains the most populous ward overall, with a population of 11,749.
Coity will likely see the biggest increase between 2011 and 2021, with the Parc Derwen development likely to add at least 2,500 people.
Not all wards experienced population rises. The Maesteg and Caerau area, Cefn Glas and Litchard/Pendre areas all lost more than 4% of their populations, with Pendre experiencing the sharpest drop of 11.9%, closely followed by Cefn Glas (-11.8%).
Population of major settlements in Bridgend County
- Bridgend (including Penyfai, Coychurch Lower & Coity wards) : 49,404
- Bridgend "Urban Area" (including the Aberkenfig/Sarn area & above) : 60,824
- Maesteg (including Caerau and Llangynwyd) : 20,612
- Porthcawl : 16,005
- Pyle/Cornelly : 14,464
- Pencoed : 10,054
In terms
of population density, the second map clearly highlights major
settlements. At least 43% of the county
live in Bridgend town itself and its immediate surroundings, with
Morfa (40.2 people per hectare), Porthcawl West Central (37.8) and
Brackla (36.6) being the most densely populated wards, and Blackmill
(1.5), Aberkenfig (1.7) and Bryncethin (1.8) the least densely
populated.
There's also the prospect, depending on how other towns have changed, that Bridgend is now pushing to be in Wales' top 5 urban areas by population.
Demography
Porthcawl is a significant pocket of wards with a higher average age compared to the rest of Bridgend county, while the younger wards tend to be the suburbs of Bridgend itself – Brackla (mean age 35.5), Coity (37.9) and Bryntirion, Laleston & Merthyr Mawr (35.1). Bettws also has a younger than average population (36.6).
This could reflect the housing market. Brackla and Broadlands attracting younger families, for example, while Porthcawl and suburbs like Litchard are known to be popular with retirees or older, stable families. It could also reflect reduced average life expectancy in deprived wards north of the M4.
There's a similar pattern reflected in the percentage of residents of pensionable age. Porthcawl is once again way out ahead of the rest of the county in terms of over 65s, with Nottage (30.1%) and Rest Bay (36.6%) having the highest percentage of pensioners in the county, closely followed by Coychurch Lower (35%). Cross reference this with the religion, national identity and limiting illness figures and you'll see a pattern.
Religion
The dominant organised religion in Bridgend is – surprise,surprise – Christianity and its denominations, with 55.1% of people describing themselves as such. The second largest organised religion is Islam. Bridgend had 529 Muslim residents in 2011, or 0.4% of the population. "Other religions" are the third largest group, closely followed by Buddhists and Hindus (0.4, 0.3 & 0.2% of the population respectively). All of these smaller religions saw growth in numbers between 2001 and 2011. 43.7% of people were irreligious or gave no religion.
What's clear is that Christianity is strongest in the Porthcawl and Maesteg areas, and the leafier suburbs and villages surrounding Bridgend (Litchard, Cefn Cribwr, Pen-y-fai and Coychurch). Compare that map with the one for over 65s further up and that perhaps explains why. It also corresponds roughly with where religious-affiliated primary schools are.
In terms of the non religious, there's a uniform rise across the borough, echoing national trends, with a few exceptions – notably Pendre and Coychurch. Pendre has a very committed community church in the ward, and shares its neighbourhood with the Princess of Wales Hospital, becoming a popular base for Filipino nurses. Filipinos being amongst the world's most devout Catholics, and Bridgend also has a large Polish contingent.
National Identity
There's a very clear north-south split between a strong Welsh identity in the valleys, and a still strong, but weaker, Welsh identity in Bridgend constituency and Pencoed.
The strongest Welsh identity is in the upper Llynfi valley - all wards above 85%. The weakest is in the eastern half of Bridgend – Coity (66.8%), Brackla (68.5%), Coychurch Lower (67.9%) - and Porthcawl.
It almost flips to the exact opposite when it comes to English identity, with stronger English identity south of the M4 – almost exactly mirroring the figures for Welsh identity. However, the English remain a relatively small minority, with only 7 wards having an English population above 10%, with the largest in Coity (14.8%).
British-only identity is weak across the county, with the strongest being in the southern half – in particular Porthcawl (averaging around 18%) - and the weakest north of the M4, with several wards recording single figure levels of "Britishness". The average is around 13.5% per ward.
Place of Birth
There's another clear north-south split, with more people in the southern half of the county being born outside Wales than the valleys. There's an average of 17% per ward, but it's higher than 20% in 11 wards – all of them in Bridgend town and Porthcawl. The lowest percentages of people born outside Wales are in the Maesteg area, with around 7% in Caerau, Maesteg East & West.
In terms of how it has changed since 2001, there's no clear pattern, but the Bridgend area, Garw Valley and Ogwr Valley have seen the biggest upward change. Nantymoel surprisingly saw the biggest increase at 6.3%, closely followed by Oldcastle (3.8%) and Cefn Glas (3.5%).
Penyfai saw the sharpest fall at -2.7%, with Litchard the next closest at -1.2%. There's a bit of a surprise that Bryntirion, Laleston and Merthyr Mawr has seen a fall (-0.8%), as you would've expected the executive homes in Broadlands to have attracted English migrants in particular. Similarly the Porthcawl area.
Similar to national trends, the raw numbers indicate the increase being mostly down to European Union migration since 2004 enlargement, with the English-born topping it up.
Qualification Levels
Another clear north-south split. The big cluster of high numbers of people with no qualifications are the three valleys, with Bettws (48.5%), Caerau (44.5%) and Sarn (39.5%) all possessing exceptionally high levels. The average for wards north of the M4 appears to be in the low 30s, while south of the M4, only Morfa (31.4%) stands out as particularly high.
So there's a clear, indisputable link between poor education and deprivation, illustrated graphically on the map, as the wards with high levels of the unqualified are amongst the most deprived wards in the county.
On the flipside, wards south of the M4 generally have the higher proportions of people holding at least a degree level qualification. The highest in Rest Bay (39.4%), followed by two other Porthcawl wards – Newton (35.4%) and Nottage (34.5%). Bryntirion, Laleston & Merthyr Mawr (36.6%) and Coychurch Lower (30.4%) also had high percentages. This points towards the executive homes in Broadlands being popular with the professional middle classes, and migration of retirees holding degrees.
Most people in Bridgend fell "in between". However, on average in each ward, those with no qualifications (30%) outnumber those with degrees (22.5%). The general trend is a rapid move towards a better qualified population, like the rest of Wales.
Limiting Illnesses
There's no set pattern across the county in terms of the proportion of people with limiting disabilities (describing themselves as in bad or very bad health). The ward average was 26.2% in 2011. The valleys, Porthcawl and some suburbs of Bridgend appear to be the areas with more disabled or ill compared to the rest.
As to how this has changed, there's a surprise in store. It appears as though the health and well being of people north of the M4 is improving – especially in the Ogwr and Garw valleys (and Cornelly). Ynysawdre saw the sharpest fall of 5%.
However, the health of people in the southern half of the county, especially Bridgend and Porthcawl, appears to be getting worse. This reflects the national trend where "wealthier" areas have seen declines in overall health compared to the stereotyped valleys. Coychurch Lower, for example, saw an 8% rise in limiting illnesses compared to 2001.
When you cross reference this with the age figures you can see that not only are long-standing problems with disabilities apparent, but it also highlights the impact of an ageing population, with "older wards" like Nottage, Newton, Rest Bay and Coychurch Lower having higher percentages of those with limiting illnesses compared to "younger" wards like Brackla.
Welsh speakers
Bridgend has never really been a hotbed of the Welsh language, being one of the more Anglicised parts of south Wales. However, there are pockets of strong Welsh-speaking ability – in particular the Maesteg area. Llangynwyd had the highest percentage of Welsh speakers aged over 3 in the county at 18.9%. What is a bit of a surprise though is that both Penyfai (15.1%) and Bryncethin (16.7%) also have quite strong figures.
Overall though, Bridgend county remains well below the national average for Welsh speakers, with an average of 13.5% per ward.
Like national figures, the trend has been downwards since 2001. Although Llangynwyd was the only ward with a 20%+ percentage in 2001, there were several other wards in the high teens at the same time. Across the county, the Welsh speaking population fell on average by 2.5% per ward, with sharper declines in : Coity (-7.4%), Litchard (-4.9%) and Oldcastle (-4.6%).
Only two wards saw a rise – Bryncoch and Bryncethin (both +0.3%). The numbers also held up relatively well in Pencoed and the western half of Bridgend itself – in particular Bryntirion.
Taking the two figures together, it hints that future demand for Welsh medium education is likely to come either from the Ynysawdre/Sarn area, or western Bridgend (Penyfai, Broadlands, Bryntirion).
There's also the prospect, depending on how other towns have changed, that Bridgend is now pushing to be in Wales' top 5 urban areas by population.
Demography
![]() |
| Mean age per ward (Click to enlarge) |
![]() |
| % of the resident population aged 65+ (Click to enlarge) |
Porthcawl is a significant pocket of wards with a higher average age compared to the rest of Bridgend county, while the younger wards tend to be the suburbs of Bridgend itself – Brackla (mean age 35.5), Coity (37.9) and Bryntirion, Laleston & Merthyr Mawr (35.1). Bettws also has a younger than average population (36.6).
This could reflect the housing market. Brackla and Broadlands attracting younger families, for example, while Porthcawl and suburbs like Litchard are known to be popular with retirees or older, stable families. It could also reflect reduced average life expectancy in deprived wards north of the M4.
There's a similar pattern reflected in the percentage of residents of pensionable age. Porthcawl is once again way out ahead of the rest of the county in terms of over 65s, with Nottage (30.1%) and Rest Bay (36.6%) having the highest percentage of pensioners in the county, closely followed by Coychurch Lower (35%). Cross reference this with the religion, national identity and limiting illness figures and you'll see a pattern.
Religion
![]() |
| % of the population describing themselves as "Christian" in 2011 (Click to enlarge) |
![]() |
| Change in % of non-religious 2001-2011 (Click to enlarge) |
The dominant organised religion in Bridgend is – surprise,surprise – Christianity and its denominations, with 55.1% of people describing themselves as such. The second largest organised religion is Islam. Bridgend had 529 Muslim residents in 2011, or 0.4% of the population. "Other religions" are the third largest group, closely followed by Buddhists and Hindus (0.4, 0.3 & 0.2% of the population respectively). All of these smaller religions saw growth in numbers between 2001 and 2011. 43.7% of people were irreligious or gave no religion.
What's clear is that Christianity is strongest in the Porthcawl and Maesteg areas, and the leafier suburbs and villages surrounding Bridgend (Litchard, Cefn Cribwr, Pen-y-fai and Coychurch). Compare that map with the one for over 65s further up and that perhaps explains why. It also corresponds roughly with where religious-affiliated primary schools are.
In terms of the non religious, there's a uniform rise across the borough, echoing national trends, with a few exceptions – notably Pendre and Coychurch. Pendre has a very committed community church in the ward, and shares its neighbourhood with the Princess of Wales Hospital, becoming a popular base for Filipino nurses. Filipinos being amongst the world's most devout Catholics, and Bridgend also has a large Polish contingent.
National Identity
![]() |
| % of residents giving some or exclusive Welsh identity in 2011 (Click to enlarge) |
![]() |
| % of residents giving some or exclusive English national identity in 2011 (Click to enlarge) |
There's a very clear north-south split between a strong Welsh identity in the valleys, and a still strong, but weaker, Welsh identity in Bridgend constituency and Pencoed.
The strongest Welsh identity is in the upper Llynfi valley - all wards above 85%. The weakest is in the eastern half of Bridgend – Coity (66.8%), Brackla (68.5%), Coychurch Lower (67.9%) - and Porthcawl.
It almost flips to the exact opposite when it comes to English identity, with stronger English identity south of the M4 – almost exactly mirroring the figures for Welsh identity. However, the English remain a relatively small minority, with only 7 wards having an English population above 10%, with the largest in Coity (14.8%).
British-only identity is weak across the county, with the strongest being in the southern half – in particular Porthcawl (averaging around 18%) - and the weakest north of the M4, with several wards recording single figure levels of "Britishness". The average is around 13.5% per ward.
Place of Birth
![]() |
| % of residents not born in Wales in 2011 (Click to enlarge) |
![]() |
| Change in % of residents not born in Wales 2001-2011 (Click to enlarge) |
There's another clear north-south split, with more people in the southern half of the county being born outside Wales than the valleys. There's an average of 17% per ward, but it's higher than 20% in 11 wards – all of them in Bridgend town and Porthcawl. The lowest percentages of people born outside Wales are in the Maesteg area, with around 7% in Caerau, Maesteg East & West.
In terms of how it has changed since 2001, there's no clear pattern, but the Bridgend area, Garw Valley and Ogwr Valley have seen the biggest upward change. Nantymoel surprisingly saw the biggest increase at 6.3%, closely followed by Oldcastle (3.8%) and Cefn Glas (3.5%).
Penyfai saw the sharpest fall at -2.7%, with Litchard the next closest at -1.2%. There's a bit of a surprise that Bryntirion, Laleston and Merthyr Mawr has seen a fall (-0.8%), as you would've expected the executive homes in Broadlands to have attracted English migrants in particular. Similarly the Porthcawl area.
Similar to national trends, the raw numbers indicate the increase being mostly down to European Union migration since 2004 enlargement, with the English-born topping it up.
Qualification Levels
![]() |
| % of residents with no qualifications in 2011 (Click to enlarge) |
![]() |
| % of residents with at least a degree-level qualification in 2011 (Click to enlarge) |
Another clear north-south split. The big cluster of high numbers of people with no qualifications are the three valleys, with Bettws (48.5%), Caerau (44.5%) and Sarn (39.5%) all possessing exceptionally high levels. The average for wards north of the M4 appears to be in the low 30s, while south of the M4, only Morfa (31.4%) stands out as particularly high.
So there's a clear, indisputable link between poor education and deprivation, illustrated graphically on the map, as the wards with high levels of the unqualified are amongst the most deprived wards in the county.
On the flipside, wards south of the M4 generally have the higher proportions of people holding at least a degree level qualification. The highest in Rest Bay (39.4%), followed by two other Porthcawl wards – Newton (35.4%) and Nottage (34.5%). Bryntirion, Laleston & Merthyr Mawr (36.6%) and Coychurch Lower (30.4%) also had high percentages. This points towards the executive homes in Broadlands being popular with the professional middle classes, and migration of retirees holding degrees.
Most people in Bridgend fell "in between". However, on average in each ward, those with no qualifications (30%) outnumber those with degrees (22.5%). The general trend is a rapid move towards a better qualified population, like the rest of Wales.
Limiting Illnesses
![]() |
| % of population with a limiting illness in 2011 (Click to enlarge) |
![]() |
| Change in % of population with limiting illnesses 2001-2011 (Click to enlarge) |
There's no set pattern across the county in terms of the proportion of people with limiting disabilities (describing themselves as in bad or very bad health). The ward average was 26.2% in 2011. The valleys, Porthcawl and some suburbs of Bridgend appear to be the areas with more disabled or ill compared to the rest.
As to how this has changed, there's a surprise in store. It appears as though the health and well being of people north of the M4 is improving – especially in the Ogwr and Garw valleys (and Cornelly). Ynysawdre saw the sharpest fall of 5%.
However, the health of people in the southern half of the county, especially Bridgend and Porthcawl, appears to be getting worse. This reflects the national trend where "wealthier" areas have seen declines in overall health compared to the stereotyped valleys. Coychurch Lower, for example, saw an 8% rise in limiting illnesses compared to 2001.
When you cross reference this with the age figures you can see that not only are long-standing problems with disabilities apparent, but it also highlights the impact of an ageing population, with "older wards" like Nottage, Newton, Rest Bay and Coychurch Lower having higher percentages of those with limiting illnesses compared to "younger" wards like Brackla.
Welsh speakers
![]() |
| % of over 3s who can speak, read or write Welsh in 2011 (Click to enlarge) |
![]() |
| Change in % of over 3s who can speak, read or write Welsh 2001-2011 (Click to enlarge) |
Bridgend has never really been a hotbed of the Welsh language, being one of the more Anglicised parts of south Wales. However, there are pockets of strong Welsh-speaking ability – in particular the Maesteg area. Llangynwyd had the highest percentage of Welsh speakers aged over 3 in the county at 18.9%. What is a bit of a surprise though is that both Penyfai (15.1%) and Bryncethin (16.7%) also have quite strong figures.
Overall though, Bridgend county remains well below the national average for Welsh speakers, with an average of 13.5% per ward.
Like national figures, the trend has been downwards since 2001. Although Llangynwyd was the only ward with a 20%+ percentage in 2001, there were several other wards in the high teens at the same time. Across the county, the Welsh speaking population fell on average by 2.5% per ward, with sharper declines in : Coity (-7.4%), Litchard (-4.9%) and Oldcastle (-4.6%).
Only two wards saw a rise – Bryncoch and Bryncethin (both +0.3%). The numbers also held up relatively well in Pencoed and the western half of Bridgend itself – in particular Bryntirion.
Taking the two figures together, it hints that future demand for Welsh medium education is likely to come either from the Ynysawdre/Sarn area, or western Bridgend (Penyfai, Broadlands, Bryntirion).
Thursday, 2 May 2013
Census 2011 : Demographics II - Its meaning for Wales
By OwenThursday, May 02, 2013Anglesey, Cardiff, Care, Census 2011, Ceredigion, Disability, Elderly, EnglishM, Gwynedd, Housing, Iaith Gymraeg, Nationality, Planning, PubServ, Universities, Welfare11 comments
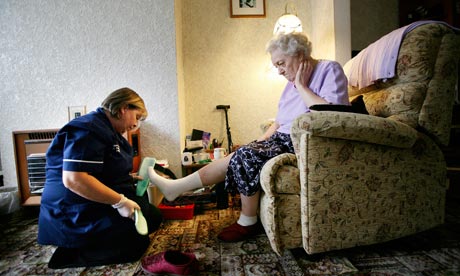
| What are the possible consequences of an ageing population? (Pic : The Guardian) |
- Census 2011 : What's stunting Welsh?
- Census 2011 : Losing our religion?
- Census 2011 : National Identity & Ethnicity
- Census 2011 : Disability, Carers & Health
- Census 2011 : Qualifications
- Census 2011 : Demographics I – How old is Wales?
Firstly, I forgot to include the data I used yesterday (2001, 2011).
Following on from yesterday's post, I'm going to look at some of the possible implications of the demographic/age changes in more detail. But to summarise – for those of you who can't be bothered to sift through the last post:
- Wales' mean age was 40.6, median 41 – second highest of the regions of EnglandandWales.
- 18.3% of Wales' population in 2011 was aged 65+ - a rise of 0.9% on 2001 – with much higher levels in rural central and northern Wales.
- 45.2% of Welsh residents were aged between 30-64 – a fall of 2.3% on 2001.
- The percentage of school age children fell by 3.4% nationally, but there was no change with regard pre-school children (0-4 y.o.).
- The percentage of young adults (18-29) rose by 1.8% on 2001, seeing bigger rises in urban areas of Wales, with the notable exception of Ceredigion.
Impact on the Welsh language
Back in January, I posted my musings on the fall in Welsh speakers. I made several guesses as to why that happened.
Firstly, the mortality and migration issues. Y Fro – Anglesey aside - isn't as old as I was expecting. However, all 4 Y Fro counties do have above-average levels of pensioners, and they've also seen some of the biggest increases in pensionable populations since 2001 – again, in particular Anglesey.
When you cross-reference this with the falls in Welsh speakers, I think this will have had an impact in Ceredigion and possibly Carmarthenshire, but less so in Anglesey or Gwynedd. The latter two didn't see as sharp a drop in Welsh-speakers as the southern half of Y Fro. So I think mortality at least – an older population, including a fair chunk of Welsh speakers, dying naturally - is just one small bit player in a complicated set of circumstances.
It's hard to tell whether "elderly migration" had a similar impact. As far I can tell, the figures aren't broken down by age. I suspect it will have, especially if those migrating aren't Welsh-speakers. But as I pointed out then, significant numbers of migrants to Y Fro are from other Welsh local authorities – especially into Ceredigion – while English migration isn't as pronounced compared to European immigration or those from further afield.
When you look at the rise in "young adults" in Ceredigion alone, I was probably right to include the expansion of university education – and an increased in-migration of non Welsh-speaking 18-21 year olds – as a possible factor.
One thing I did say, was that there was cause to be upbeat because of a clear, positive "demographic shift" towards the young in terms of numbers and percentage of Welsh-speakers. Blog Menai has also pointed out that amongst the over-20s, Welsh speakers are on average younger than non-Welsh speakers. However, viewing this in itself as a possible saviour of the Welsh language might be a little over-optimistic.
Ceredigion already had one of the lowest percentages of school age children, and it's quite likely that in 2021, school age children might fall into a single figure percentage of the Ceredigion population. Gwynedd and Anglesey also have fairly "low" percentages of school-age children resident. Although there's a definite demographic "bulge", with Welsh-speakers overall becoming younger, in terms of strength in numbers it's unlikely to make that much of a difference.
There'll be more Welsh-speaking young people (under 30s) in 20-30 years time for sure – perhaps 30%+ of the population even outside Y Fro. But they're still going to be outnumbered by pensioners in terms of sheer numbers. Quite a few of them are likely to leave and bring up children elsewhere. So as much as shoring up the heartland is important, it's equally important to meet demand for Welsh-medium education elsewhere in Wales too.
So my guess is the physical number of Welsh speakers will go up nationally. But if that doesn't exceed the pace of general population growth - topped up by non-Welsh speaking elderly migrants - then Welsh speakers as a percentage of the population will stagnate or continue a slow decline (inside and outside Y Fro) or struggle to breach 20% of the Welsh population.
But it's worth pointing out that demographic projections aren't an exact science and tend to "wobble" quite often.
Impact on the economy
The main factor here is the "productive population" - the numbers of working age people with jobs, generating wealth measured as gross value added (GVA).
GVA is divided amongst the total population to get headline GVA per capita figures. That means pensioners, temporary and long-term unemployed or disabled and school age children are included - not just the "working" working age population.
GVA is rural areas is low anyway. That's perhaps because sectors like agriculture and tourism don't generate as much for the economy as a whole compared to financial services or manufacturing - the latter two generally based in urban areas and city regions.
In parts of Wales with higher numbers of disabled people, pensioners, or higher numbers of those in full-time study too (in the case of Gwynedd and Ceredigion) - the "productive population" is going to be significantly lower than somewhere like Cardiff. Therefore, an already weak GVA is divided by more (statistically) "unproductive" heads, producing weaker GVA per capita figures that it perhaps otherwise should be.
So there's probably a warning that, although GVA is useful in measuring economic strength, it isn't the be all and end all of an economic story on the ground.
Impact on key public services
The main issue here as I see it is the dependency ratio. Dependency ratios measure the relative demographic "burden" placed on an area's working age population by those outside the labour market (children and pensioners). You can have separate child dependency ratios and old dependency ratios too.
The higher the dependency ratio, the more a government has to spend or provide things like education, pensions and social services for children and the elderly. It's fair to point out though that some pensioners might still be in the labour market, and the retirement age is rising to 66 by 2020.
It's calculated to international standards by:
- The number of full-time school children (defined as 0-15 by international measures) and pensioners (65+) added together
- Divided by the working age population (15-64)
- Times by 100
![]() |
| Dependency ratios nationally and in each local authority in 2011 (Click to enlarge) |
In Wales, the dependency ratio is at 54.6, compared to 51 for the UK as a whole. That means Wales bares a slightly higher "burden" of dependents than the rest of the UK. We probably knew that anyway.
However, at individual local authority level, some of the figures are jaw-dropping. Five local authorities have a dependency ratio above 60.
Old age dependency ratios are perhaps more important here, as they're usually out of the workforce permanently and place a greater relative burden on health and personal social services, whilst school-age children will eventually join the workforce.
Some Welsh local authorities currently have levels of old age dependency that the UK as a whole isn't expecting to see until the 2050s! (30-40) And all of them are in the "West Wales & The Valleys" EU region. Remember what I said about GVA figures earlier. Is it any wonder why the Welsh economy struggles if these are the sorts of numbers bandied about?
Wales, as a whole, has an old age dependency ratio of 28.4. So there's roughly 3 working age people for every 1 pensioner. In some Welsh authorities, it's already lower than that that.
That doesn't necessarily mean there'll be strain on things like social services and health, as long as people have a long healthy life expectancy so they don't need to rely on those things in the first place.
If we don't live healthier lives in old age, then it'll t means we'll need to consider immigration of 16-40 year olds to work, pay tax and support pensioners; as well as a higher birth rate – especially in rural Wales - to provide more sustainable levels of working age people down the line.
It's also significantly more expensive to provide services in sparsely-populated rural areas than urban areas for a whole host of reasons. It will probably be better (for the state) for the elderly to live somewhere like Cardiff compared to Conwy. But peace and quiet is something retired people might want. We either need to either quietly discourage that, or come up with ways to live with it.
When you factor in things like a higher relative percentage of working age people with disabilities too – who aren't counted as dependents, but who don't work - there are still major challenges facing parts of Wales.
Impact on politics
It's unclear. The number of pensioners hasn't massively changed nationally since 2001, but in individual constituencies and regions, the numbers of pensioners could have an impact on politics locally.
It's anecdotal evidence, but older people are generally more conservative, more eurosceptic and in Y Fro neither likely or unlikely to speak Welsh as well as being cultural nationalists (both Welsh and "British"). They also turn out more at election time.
Another thing that the figures highlight is that 40-70 year olds are too dominant in politics at all levels in Wales. Maybe that's for good reason, because people want to elect someone with "life experience". Perhaps now you can see why those aged under 30 are switching off from politics altogether, or more interested in taking up single-issue causes/activism as opposed to institutions like local councils, the Assembly, Westminster and the European Parliament.
There's a massive risk of creating a generation gap in Welsh politics that will be hard to close because young people will never become interested in mainstream party politics in the first place. It's entirely plausible that political parties in Wales will struggle to recruit new members and candidates in the long-term, because politics has effectively turned its back on an entire generation.
There are numerous examples proving younger people can be elected to office at all levels. But having one or two "token" young politicians in local government, or putting them in the ghetto of student/"yoof" politics, doesn't cut it if politics wants to be representative.
For example, based on the census figures, the Assembly should currently have at least 9 AMs aged between 18-29 and 10-11AMs aged over 65. Though they're not far off the latter, they fall way, way short of the former.
Unfortunate implications in The Valleys
The general "youth" in the valleys could be down to at least two factors.
The first one is shorter life expectancies than the rest of Wales, dragging average ages – especially means – downwards.
The second one could be a result of people having children younger, including teenage pregnancies. This means that the percentages of young adults and school age children are boosted, as there would have been more young adults and 15-16 year olds having children than the Welsh average over the census period – though the numbers of teenage pregnancies are falling.
Now, teenage pregnancies aren't a "good thing". However, in the long-term it could help keep old age dependency ratios in the Valleys at a more sustainable level, but that'll only work if the economy improves. Those kids being born to younger parents will need to be well brought up, well-educated and have decent jobs waiting for them when they're older.
How can we keep Wales "young"?
I don't know what a "good" old age dependency ratio would be, but I'd guess we should aim to get it down towards 20% nationally, allowing a bit of variation between local authorities.
First and foremost – boost the birth rate. However, it's nowhere near as easy as that, as having children is dependent on a whole host of other things.
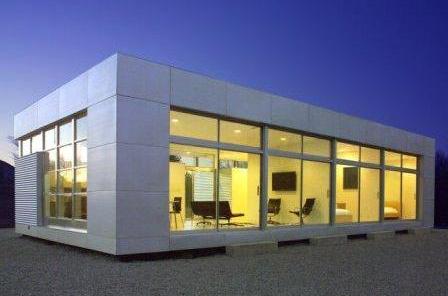
| Do we need to place less emphasis on owning property as an investment? Do we need to come up with ways to build homes cheaply and retain younger families? (Pic : prefabs.com) |
There's the issues of housing and housing costs in general. We should probably not place as much emphasis on homes as an investment, as well as encouraging long-term renting and perhaps see a sustained, managed decline in house prices. One way to do that would be to increase supply, and I've covered that before. We need to build more starter homes, and those homes have to be affordable, perhaps using innovative methods of construction.
Next, there's the question of tackling under-employment. We need better paid and higher-value added jobs, particularly in rural parts of Wales, to prevent young adults and those in their 30s-40s from migrating away, leaving only the old - a ticking time bomb with regard key public services. Expanding apprenticeships and providing large numbers of low-paying, low-skilled jobs is fine as a stop gap, but there needs to be something better too, so young families can actually establish themselves.
Retaining graduates – especially home grown ones - once they've graduated is linked to the above. It doesn't seem to be too much of a problem in places like Cardiff. However, if you stem the "brain drain" across Wales, it might convince employers and companies that they can set up higher-value added enterprises, which means better jobs, more money in the local economy and hopefully, eventually lead to more children.
| How does Wales retain graduates from Welsh universities? More importantly, how do we convince employers that we have the right skill set in the first place? (Pic : BBC Wales) |
I also mentioned earlier "positive discouragement" with regard elderly people moving to rural Wales, and instead moving to urban parts of Wales to spread the older population out a bit more. By "positive discouragement" I mean doing things that might benefit a rural community as a whole, but put people off "seeking peace and quiet" : windfarms and energy projects, black metal festivals next to nursing homes, active agriculture (with all the noise and smells), planned expansion of larger rural towns, dogging, business parks, road improvements etc.
Wednesday, 1 May 2013
Census 2011 : Demographics I - How old is Wales?
By OwenWednesday, May 01, 2013Anglesey, Cardiff, Census 2011, Ceredigion, Cornwall, England, EnglishM, Flint, Gwynedd, Iaith Gymraeg, Merthyr, Nationality, Swansea, Universities4 comments
| Is Wales getting older? Are parts of Wales getting younger even? It's a mixed bag. The 2011 census throws up surprises and not-so big surprises. (Pic : The Guardian) |
- Census 2011 : What's stunting Welsh?
- Census 2011 : Losing our religion?
- Census 2011 : National Identity & Ethnicity
- Census 2011 : Disability, Carers & Health
- Census 2011 : Qualifications
Next stop on the 2011 "census tour", and it's one of the big ones. Only two more areas to go after this. Is Wales getting older? What implications will changing age demographics have on Welsh public services? And how does all this fit in with previous posts – like those on the Welsh language and disability?
I'm not going to bother breaking these figures down by gender, as that would complicate things further. You'll all know that women live longer on average than men anyway.
The Welsh Age Profile
In 2011, the mean age in Wales was 40.6, which isn't too different from the median age (41). So people aged 41 in Wales are at the "half way point" in terms of age if you split the population into two equal groups. I couldn't find any similar figures for 2001, so I can't tell how this has changed, but I suspect it's slightly upwards. You'll probably agree once you've read the rest of this.
Wales is slightly older than England (mean 39.3, median 39) and the only English region older than Wales was the South West of England (mean 41.6, median 42). In Cornwall, the figures were a mean of 43.3 and a median of 45.
![]() |
| The median age of the resident population in 2011 (Click to enlarge) |
Cardiff is significantly "younger" than the rest of Wales, with a median age of 33. Swansea (39) and Newport (38) are distant third and second places. The south Wales valleys are generally around the Welsh average, with the median age ranging between 40-42.
Conwy is the "oldest" county in Wales, with a median age of 46 and the highest mean of 44.6. Powys (median 46, mean 43.9), Anglesey (median 45, mean 43.4) and Monmouthshire (median 45, mean 43) closely follow .
In Y Fro, somewhat surprisingly, Gwynedd (median 42, mean 41.6) and Ceredigion (median 42, mean 41.7) are not really that different from the Welsh average. I would've expected Ceredigion at least to be "older", but that's probably the impact of the universities dragging the averages down. If you removed students from those two counties, then I suspect Y Fro would probably be significantly "older" on average than the figures suggest.
The Retired and Elderly (Aged 65+)
In 2011, 18.3% of the Welsh population were aged 65 or over. What will perhaps surprise you, is that it's only risen by 0.9% between 2001 and 2011. Although it's still 1 in 5 of the population near enough, I was expecting higher.
![]() |
| Resident population aged 65+ in 2011 (Click to enlarge) |
Once again, there are differences between Welsh local authorities. Cardiff has significantly fewer pensioners than any other part of Wales (13.2%). Newport, the Gwent Valleys and Merthyr Tydfil are a cluster of local authorities with fewer pensioners too, ranging between 16-17% of the population. The likes of Bridgend and Swansea (both 17.9%) follow close behind.
In the north and west though, there's clearly a much greyer population, but we probably already knew that anyway. Conwy is way out ahead of everywhere else with nearly a quarter of the population (24.4%) aged 65+. Powys (22.8), Anglesey (22.4%) and Pembrokeshire (21.8%) come closest to that. What is noticeable though is that Wrexham (17%) and Flintshire (17.6%) have South Walian low levels of pensioners.
In terms of how things have changed compared to 2001, Anglesey has seen by far and away the sharpest increase in pensioners (+3.5%), closely followed by Powys (+2.9%) and Monmouthshire (+2.8%).
What is a little surprising is that – Anglesey aside - things haven't changed very much in north Wales. It's mid and west Wales (and Monmouthshire) which is seeing a big greying of the population.
![]() |
| Change in the percentage of residents aged 65+ between 2001-2011 (Click to enlarge) |
You could even say that south Wales - and that's where most people live, especially Cardiff and Swansea - might not have aged as quickly as the government and local authorities are concerned about.
In terms of specific age groups, although the numbers of 60-74 year olds increased nationally by around 2.1% compared to 2001, there's a drop off at ages 75-84, presumably because that's the age group where most people die naturally.
2.4% of the population of Wales were aged 85+ in 2011 - a rise overall of 0.4% on 2001. Living that long probably comes down to luck and genetics – including the length of your telomeres if you want to get technical - as there's no set pattern across Wales. Torfaen, for example, has seen the same percentage growth of 85-89 year olds as Ceredigion (+0.5%).
Children & Young Adults
Some 45.2% of the Welsh population are "adults", which I'm defining as aged between 30-64. However, the number of 30-45 year olds fell by 2.3% between 2001 and 2011 – the sharpest fall of any census age group – and there were noticeably sharper falls in rural local authorities like Powys, Monmouthshire and Ceredigion.
For the sake of brevity (stop laughing), I'm not going to look into that. What I am going to look at though are younger age groups, namely school age children (5-17) and young adults (18-29). The young adult group will be particularly interesting for economic, cultural and demographic reasons.
School age children
Overall, while the percentage of pre-school children (aged 0-4) hasn't changed at all nationally from 2001, the percentage of school age children fell by 3.4%. Carmarthenshire aside, it's Y Fro counties that have the lowest percentages. Ceredigion had the lowest at 11.4%, followed by Anglesey and Gwynedd (both 12.8%).
![]() |
| Resident population aged between 5-17 in 2011 (Click to enlarge) |
![]() |
| Change in resident population aged between 5-17 (2001-2011) (Click to enlarge) |
Somewhat surprisingly, Cardiff (12.9% ) and Swansea (13%) also had lower than average school age populations. That's probably a distortion caused by a larger number of people overall.
The Gwent area and the Vale of Glamorgan had the highest school age populations, with Newport having the highest percentage nationally at 15.1%. Many of the south Wales valley authorities also had above average numbers of children.
In terms of how it's changed, it's a fairly uniform fall across Wales. Most local authorities saw a fall of around 3-4% in their school age populations, with the joint sharpest falls in Merthyr Tydfil and Blaenau Gwent (-4.7%).
In Y Fro, although the falls in the school age population aren't that different to the rest of the country, because of smaller total populations in authorities like Anglesey and Ceredigion, the effect of the "loss of the young" will likely be amplified much more than in the urban south or north east.
Young adults
The number of young adults on the other hand has increased compared to 2001 – a national rise of 1.8%. 15.8% of the Welsh population were aged between 18 and 29 in 2011.
Cardiff (24.1%) and Swansea (18.4%) – as you might expect – had some of the highest percentages of young adult residents. What was a little surprising is that Ceredigion had the second highest nationally at 21.2%. I think the reason for that's obvious – Aberystwyth & Trinity St David's Universities. Gwynedd also had a relatively high number of young adults at 16.8% of the population.
![]() |
| Percentage of the resident population aged between 18-29 in 2011 (Click to enlarge) |
![]() |
| Change in resident population aged 18-29 between 2001-2011 (Click to enlarge) |
In terms of low levels, you've got to point to rural areas of Wales like Powys (11.4%), Anglesey (12.4%), Pembrokeshire (12.6%) and the lowest in Monmouthshire (11%). All of those authorities also lack a university, it's worth pointing out.
In terms of how these numbers have changed on 2001, what's fairly obvious is that Cardiff is by some way acting as a youth magnet with a gain of 4.1%, followed by Newport (+3.1%) and Ceredigion once again (+3.1%). Merthyr Tydfil also saw a big rise of (3.1%). Is that a hint that young adults priced out of Cardiff might be moving north? Or is it just a natural demographic shift?
Some local authorities though had fairly low levels of growth. Flintshire almost flat lines at +0.2% , similarly many north Wales authorities, with the exception of Gwynedd (+1.9%).
Other southern local authorities you would've expected to see sharper growth didn't. Bridgend's young adult population only grew by 1.1%, as did Neath Port Talbot. While Rhondda Cynon Taf only saw a 1% increase.
Because there's so much here that needs to be looked into, this post has been split. The second part will be posted tomorrow and will revisit some other things – like the Welsh language – as well as what all this could mean for the Welsh economy, politics and public services.