This site is no longer updated

Please use the links in the sidebar to visit the new sites!

Showing posts with label Ogwr. Show all posts

Monday, 1 December 2014

Bridgend's Deprivation Mapped

The Caerau Park and Tudor estates are placed near the top of the most
relatively deprived areas in Wales. What about the rest of the county?
(Pic : zoopla.com)
Last week, the latest figures from the triennial Welsh Index of Multiple Deprivation (WIMD) were released by the Welsh Government and Office of National Statistics. Deprivation itself is defined, statistically, as a "lack of access to opportunities or resources".

The WIMD collects data from each of Wales' 1,909 Lower Super Output Areas (LSOAs) – there's roughly one for every 1,000-1,500 people – and compares them to each other, giving policy makers and the general public an idea how relatively deprived neighbourhoods are compared to the rest of Wales (not the rest of the local authority).

So it's important to point out from the start that ranking lowly doesn't mean a community is "affluent" and it doesn't measure precisely how deprived a community is – only how deprived a community is compared to every other community in Wales.

The WIMD has an overall ranking, but it also has 8 separate types of deprivation each LSOA is measured against, with some indicators weighing more heavily in the final ranking than others :
  • Income – Proportions of people with an income below a certain level and claiming income-based benefits and tax credits.
  • Employment – A general lack of employment, based on claims for out-of-work benefits.
  • Health – Lack of good health, including : long-term disabilities, low birth weights, cancer incidences and death rates.
  • Education – Numbers of people with no qualifications, truancy levels, university admissions and GCSE pass rates.
  • Access to Services – The ability to access everyday services essential for day-to-day living (food, GP appointments, after school clubs), and the travel times to reach such services.
  • Community Safety – Overall crime levels, based on police and fire service statistics.
  • Physical Environment – Proximity to big polluters, flood risk and air quality.
  • Housing – Lack of adequate housing, including overcrowding and no access to central heating.

In terms of the all-Wales figures, St James' in Caerphilly is now ranked as the most relatively deprived community in Wales, though many of the names towards the top are all too familiar – Rhyl West, Splott, Queensway 1 in Wrexham (Caia Park), Twyn Carno (Fochriw, I think), Penydarren 1 (Galon Uchaf area of Merthyr) and Caerau 1 in Bridgend (Caerau Park and Tudor Estates).

With the number crunching done, it's worth taking a look at the picture in Bridgend in some more detail.

Overall Ranking & Changes Compared to 2011
(Click to enlarge)
The 2014 listings aren't really all that different to those in 2011.

The areas you would expect to be more deprived were, including : Caerau, Morfa ward (which includes Wildmill), Bettws, and at a more local level the Brackla Meadows estate, Bryntirion (the area around the Labour club), the Marlas estate in North Cornelly and the Queens Avenue area of Sarn.

As you would also expect, the valleys are relatively more deprived than the coastal/Vale areas, and the suburbs of Bridgend (including Litchard, Broadlands and the Coity end of Brackla), as well as Porthcawl, come out of it rather well.

In terms of how the rankings have changed since 2011, very few areas have dramatically become relatively less deprived than they were, though Sarn 2 (the southern half of the village) fell the most places along with the Hendre area of Pencoed, Nottage in Porthcawl and Cornelly 2 (South Cornelly and Kenfig village). It looks like – despite their overall poor ranking – levels of deprivation in Caerau, Bettws and Morfa have stalled or have even improved slightly compared to the rest of Wales.

In terms of areas which have moved up the rankings, then Brackla comes off particularly badly, especially Brackla 1 (the area around Tremains Primary) and Brackla 4 (Priory Oak, Trem-y-Mor). All Garw Valley wards have slipped – and weren't in a great position in the first place – but it's Pyle 1 (a large chunk of Kenfig Hill) and Pendre – Carwyn Jones' old council ward – which have risen the sharpest in the rankings compared to 2011.

Income & Employment
(Click to enlarge)
These are perhaps two of the more important measures of deprivation as low incomes and lack of high quality employment will limit opportunities by themselves.

In terms of income, the picture perhaps isn't quite as bad as many would believe. Even in parts of the valleys – especially Pontycymer, Maesteg, Nantyfyllon (Caerau 5), Ynysawdre and Bryncethin – incomes are near enough in the middle compared to the rest of Wales, or even slightly exceeding this. These areas have lots of cheap housing and might be attractive for younger working families priced out of other areas, while Maesteg has always had a settled middle class.

Unsurprisingly, Porthcawl and the villages and suburbs of Bridgend and Pencoed do well. You need to remember though that Welsh income levels aren't great compared to the UK anyway.

With employment, however, the differences are more stark, with pronounced problems in the valleys and urban centres (Morfa, Pyle, Porthcawl East & West Central) as you might expect – Caerau 1 ranks as the 4th most deprived area in terms of employment in the whole of Wales. Bridgend doesn't do too great overall, but clearly employment opportunities are much better south of the M4 and around Pencoed than elsewhere in the county.

Health & Education
(Click to enlarge)
There are five big pockets of areas where people are more deprived in terms of health compared to the rest of Wales – Caerau & Maesteg, Nantymoel, the central Garw Valley (Bettws, Llangeinor, Ynysawdre), North Cornelly & Pyle and the big estates in and around Bridgend town centre (Wildmill, Brackla Meadows, Ystrad Fawr). Again, this shouldn't be a surprise.

As you might expect the areas with good health are Broadlands, Laleston, Litchard and Brackla. These areas are not only generally wealthier than the average, but some areas - like Brackla - are generally younger than the rest of the county.

The north-south split is starker in education than any other measure. Pretty much all of the areas with low-ranking wards in terms of educational deprivation are located in and around Porthcawl, Pencoed and Bridgend, while the valleys have numerous areas that rank in the top 20% most deprived in Wales. The M4 almost matches the boundary perfectly as even Cornelly and Pyle fit in "the north".

That doesn't mean everywhere south of the M4 is doing well (Wildmill & Brackla Meadows) or that everywhere north of the M4 is doing badly (Llangynwyd & Aberkenfig).

Access to Services & Community Safety
(Click to enlarge)
Access to services is as much an infrastructure problem as one of the facilities being in close proximity. Blaengarw and Nantymoel have quite a few shops and services close at hand, ditto the upper Llynfi valley, so these areas do well. More rural areas like Cefn Cribwr and Coychurch, as well as "overheated" areas like Broadlands, will do badly. If you're close to a town centre you're going to rank well on this, so it doesn't really tell us much.

Community safety doesn't really tell us much either, as the closer you are to a town centre, the more crime will be committed. This means urban wards like Morfa and Porthcawl West & East Central will score worse than leafy suburbs like Broadlands, Litchard, Penyfai and Newton.

Caerau, Aberkenfig and Bettws don't really count as either so their poor scores on community safety probably indicate problems other than population density - presumably high levels of anti-social behavior.

Environment & Housing

(Click to enlarge)

You would expect areas close to Bridgend and Maesteg town centres to suffer from pollution problems, but there's a strip of particularly poor-scoring areas stretching from Aberkenfig to Pencoed. I think the culprits are the M4, traffic problems caused by the awkward road layout around Bryncethin, Tondu and Sarn, the Brynmenyn industrial estate and the fact the three main tributaries of the River Ogmore confluence in this area, which is prone to floods.


Ogmore Vale stands out and I have absolutely no idea why other than the polluting industries – like car scrappage and recycling firms - on the Penllwyngwent industrial estate.

On the flipside, you would expect rural wards and Porthcawl – with its seafront and access to the sand dunes - to score well, so no real surprise there.

Housing is the category where Bridgend county on a whole does very well compared to the rest of Wales, so this is clearly one of Bridgend's core strengths. It's probably because large amounts of housing have been built since the 1970s, like Brackla, or more recently, like Broadlands and Tondu, meaning they're often of a higher spec than the terraced houses of old. It's generally the areas where Edwardian and Victorian terraced houses are the only option – like the Garw Valley, Morfa 1 & 3 and Oldcastle 1 (the area around Nolton Street and Cowbridge Road) – which score poorly.

What can we learn from WIMD 2014?
Is enough being done in Bridgend's relatively deprived neighbourhoods?
(Pic : Wildmill Communities First)

Things haven't changed dramatically – As I've said, the areas of Bridgend you would've expected to rank towards the top and bottom have done so. Although these figures are relative, it's hard to tell if Welsh Government and local authority schemes like Communities First are really targeting the core issues that result in higher deprivation : unemployment, poor education and low incomes.

A better environment doesn't mean better life chances – The Bridgend valleys boast some of the finest scenery in south Wales, and since the end of mining, the environment of these areas has improved. The people there are still broadly worse off than those living in and around the M4 though. It makes you wonder if "sustainable development" is really going to improve people's well being or not, and whether local communities are being assisted to make the most of the natural environment.

Sarn and Pencoed are on the up; Brackla and Pendre are on the way down – Again, you have to remember that these figures are relative, but what's clear is that Sarn and Pencoed are becoming relatively less deprived compared to the surrounding areas, while Brackla and Pendre are starting to slip. Brackla is also, arguably, the most diverse council ward in Bridgend, as you can go from some of Wales' most grinding deprivation to some of its swankiest postcodes in a 20 minute walk.

Something needs to be done with "the usual suspects" – Marlas, Caerau, Bettws, Wildmill, Brackla Meadows - yet again they're mentioned for the wrong reasons. I could probably write fifty blogs on the state of Bridgend, but the question remains - what can be done to turn these areas around? With regard Caerau, in the last fortnight I mentioned there were plans for a holiday resort in the Afan Valley, which might generate much needed employment in the area and make use of Caerau's strengths – but those plans have stalled. Valleys 2 Coast had/have plans for housing renewal programmes in Wildmill (pdf) and Careau Park (pdf) too, but again presumably nothing will happen without the funding. New houses won't necessarily solve problems relating to crime, unemployment and low incomes either.


Saturday, 13 July 2013

Census 2011 : A Changing Bridgend

In this final look at the 2011 census data, I'm going to look at Bridgend down to ward level to see how the county's changed between 2001 and 2011. I've used an ONS data table tool to compile this.

If you have no idea which ward is which, here's a map :
Map of Bridgend Council wards
(Click to enlarge)


Population & Population Density

Change in population 2001-2011
(Click to enlarge)
Population density per ward in 2011
(Click to enlarge)


The population of Bridgend County rose by ~10,500 between 2001 and 2011, from 128,645 to 139,178. Most of that can be accounted to housing developments. Brackla and Cornelly's population rose by over 1,000 each, while in Bryntirion, Laleston & Merthyr Mawr it rose by a whopping 4,417 – almost certainly due to the Broadlands development – and more than doubling the population of the ward (+102% increase).

Brackla remains the most populous ward overall, with a population of 11,749.

Coity will likely see the biggest increase between 2011 and 2021, with the Parc Derwen development likely to add at least 2,500 people.

Not all wards experienced population rises. The Maesteg and Caerau area, Cefn Glas and Litchard/Pendre areas all lost more than 4% of their populations, with Pendre experiencing the sharpest drop of 11.9%, closely followed by Cefn Glas (-11.8%).

Population of major settlements in Bridgend County
  • Bridgend (including Penyfai, Coychurch Lower & Coity wards) : 49,404
  • Bridgend "Urban Area" (including the Aberkenfig/Sarn area & above) : 60,824
  • Maesteg (including Caerau and Llangynwyd) : 20,612
  • Porthcawl : 16,005
  • Pyle/Cornelly : 14,464
  • Pencoed : 10,054
In terms of population density, the second map clearly highlights major settlements. At least 43% of the county live in Bridgend town itself and its immediate surroundings, with Morfa (40.2 people per hectare), Porthcawl West Central (37.8) and Brackla (36.6) being the most densely populated wards, and Blackmill (1.5), Aberkenfig (1.7) and Bryncethin (1.8) the least densely populated.

There's also the prospect, depending on how other towns have changed, that Bridgend is now pushing to be in Wales' top 5 urban areas by population.


Demography

Mean age per ward
(Click to enlarge)
% of the resident population aged 65+
(Click to enlarge)


Porthcawl is a significant pocket of wards with a higher average age compared to the rest of Bridgend county, while the younger wards tend to be the suburbs of Bridgend itself – Brackla (mean age 35.5), Coity (37.9) and Bryntirion, Laleston & Merthyr Mawr (35.1). Bettws also has a younger than average population (36.6).

This could reflect the housing market. Brackla and Broadlands attracting younger families, for example, while Porthcawl and suburbs like Litchard are known to be popular with retirees or older, stable families. It could also reflect reduced average life expectancy in deprived wards north of the M4.

There's a similar pattern reflected in the percentage of residents of pensionable age. Porthcawl is once again way out ahead of the rest of the county in terms of over 65s, with Nottage (30.1%) and Rest Bay (36.6%) having the highest percentage of pensioners in the county, closely followed by Coychurch Lower (35%). Cross reference this with the religion, national identity and limiting illness figures and you'll see a pattern.

Religion

% of the population describing themselves
as "Christian" in 2011
(Click to enlarge)
Change in % of non-religious 2001-2011
(Click to enlarge)


The dominant organised religion in Bridgend is – surprise,surprise – Christianity and its denominations, with 55.1% of people describing themselves as such. The second largest organised religion is Islam. Bridgend had 529 Muslim residents in 2011, or 0.4% of the population. "Other religions" are the third largest group, closely followed by Buddhists and Hindus (0.4, 0.3 & 0.2% of the population respectively). All of these smaller religions saw growth in numbers between 2001 and 2011. 43.7% of people were irreligious or gave no religion.

What's clear is that Christianity is strongest in the Porthcawl and Maesteg areas, and the leafier suburbs and villages surrounding Bridgend (Litchard, Cefn Cribwr, Pen-y-fai and Coychurch). Compare that map with the one for over 65s further up and that perhaps explains why. It also corresponds roughly with where religious-affiliated primary schools are.

In terms of the non religious, there's a uniform rise across the borough, echoing national trends, with a few exceptions – notably Pendre and Coychurch. Pendre has a very committed community church in the ward, and shares its neighbourhood with the Princess of Wales Hospital, becoming a popular  base for Filipino nurses. Filipinos being amongst the world's most devout Catholics, and Bridgend also has a large Polish contingent.

National Identity

% of residents giving some or
exclusive Welsh identity in 2011
(Click to enlarge)
% of residents giving some or exclusive
English national identity in 2011
(Click to enlarge)

There's a very clear north-south split between a strong Welsh identity in the valleys, and a still strong, but weaker, Welsh identity in Bridgend constituency and Pencoed.

The strongest Welsh identity is in the upper Llynfi valley - all wards above 85%. The weakest is in the eastern half of Bridgend – Coity (66.8%), Brackla (68.5%), Coychurch Lower (67.9%) - and Porthcawl.

It almost flips to the exact opposite when it comes to English identity, with stronger English identity south of the M4 – almost exactly mirroring the figures for Welsh identity. However, the English remain a relatively small minority, with only 7 wards having an English population above 10%, with the largest in Coity (14.8%).

British-only identity is weak across the county, with the strongest being in the southern half – in particular Porthcawl (averaging around 18%) - and the weakest north of the M4, with several wards recording single figure levels of "Britishness". The average is around 13.5% per ward.

Place of Birth

% of residents not born in Wales in 2011
(Click to enlarge)
Change in % of residents not born in Wales
2001-2011
(Click to enlarge)

There's another clear north-south split, with more people in the southern half of the county being born outside Wales than the valleys. There's an average of 17% per ward, but it's higher than 20% in 11 wards – all of them in Bridgend town and Porthcawl. The lowest percentages of people born outside Wales are in the Maesteg area, with around 7% in Caerau, Maesteg East & West.

In terms of how it has changed since 2001, there's no clear pattern, but the Bridgend area, Garw Valley and Ogwr Valley have seen the biggest upward change. Nantymoel surprisingly saw the biggest increase at 6.3%, closely followed by Oldcastle (3.8%) and Cefn Glas (3.5%).

Penyfai saw the sharpest fall at -2.7%, with Litchard the next closest at -1.2%. There's a bit of a surprise that Bryntirion, Laleston and Merthyr Mawr has seen a fall (-0.8%), as you would've expected the executive homes in Broadlands to have attracted English migrants in particular. Similarly the Porthcawl area.

Similar to national trends, the raw numbers indicate the increase being mostly down to European Union migration since 2004 enlargement, with the English-born topping it up.


Qualification Levels
% of residents with no qualifications in 2011
(Click to enlarge)
% of residents with at least a degree-level
qualification in 2011
(Click to enlarge)

Another clear north-south split. The big cluster of high numbers of people with no qualifications are the three valleys, with Bettws (48.5%), Caerau (44.5%) and Sarn (39.5%) all possessing exceptionally high levels. The average for wards north of the M4 appears to be in the low 30s, while south of the M4, only Morfa (31.4%) stands out as particularly high.

So there's a clear, indisputable link between poor education and deprivation, illustrated graphically on the map, as the wards with high levels of the unqualified are amongst the most deprived wards in the county.

On the flipside, wards south of the M4 generally have the higher proportions of people holding at least a degree level qualification. The highest in Rest Bay (39.4%), followed by two other Porthcawl wards – Newton (35.4%) and Nottage (34.5%). Bryntirion, Laleston & Merthyr Mawr (36.6%) and Coychurch Lower (30.4%) also had high percentages. This points towards the executive homes in Broadlands being popular with the professional middle classes, and migration of retirees holding degrees.

Most people in Bridgend fell "in between". However, on average in each ward, those with no qualifications (30%) outnumber those with degrees (22.5%). The general trend is a rapid move towards a better qualified population, like the rest of Wales.

Limiting Illnesses

% of population with a limiting
illness in 2011
(Click to enlarge)
Change in % of population with limiting
illnesses 2001-2011
(Click to enlarge)


There's no set pattern across the county in terms of the proportion of people with limiting disabilities (describing themselves as in bad or very bad health). The ward average was 26.2% in 2011. The valleys, Porthcawl and some suburbs of Bridgend appear to be the areas with more disabled or ill compared to the rest.

As to how this has changed, there's a surprise in store. It appears as though the health and well being of people north of the M4 is improving – especially in the Ogwr and Garw valleys (and Cornelly). Ynysawdre saw the sharpest fall of 5%.

However, the health of people in the southern half of the county, especially Bridgend and Porthcawl, appears to be getting worse. This reflects the national trend where "wealthier" areas have seen declines in overall health compared to the stereotyped valleys. Coychurch Lower, for example, saw an 8% rise in limiting illnesses compared to 2001.

When you cross reference this with the age figures you can see that not only are long-standing problems with disabilities apparent, but it also highlights the impact of an ageing population, with "older wards" like Nottage, Newton, Rest Bay and Coychurch Lower having higher percentages of those with limiting illnesses compared to "younger" wards like Brackla.


Welsh speakers

% of over 3s who can speak, read or
write Welsh in 2011
(Click to enlarge)
Change in % of over 3s who can speak,
read or write Welsh 2001-2011
(Click to enlarge)

Bridgend has never really been a hotbed of the Welsh language, being one of the more Anglicised parts of south Wales. However, there are pockets of strong Welsh-speaking ability – in particular the Maesteg area. Llangynwyd had the highest percentage of Welsh speakers aged over 3 in the county at 18.9%. What is a bit of a surprise though is that both Penyfai (15.1%) and Bryncethin (16.7%) also have quite strong figures.

Overall though, Bridgend county remains well below the national average for Welsh speakers, with an average of 13.5% per ward.

Like national figures, the trend has been downwards since 2001. Although Llangynwyd was the only ward with a 20%+ percentage in 2001, there were several other wards in the high teens at the same time. Across the county, the Welsh speaking population fell on average by 2.5% per ward, with sharper declines in  : Coity (-7.4%), Litchard (-4.9%) and Oldcastle (-4.6%).

Only two wards saw a rise – Bryncoch and Bryncethin (both +0.3%). The numbers also held up relatively well in Pencoed and the western half of Bridgend itself – in particular Bryntirion.

Taking the two figures together, it hints that future demand for Welsh medium education is likely to come either from the Ynysawdre/Sarn area, or western Bridgend (Penyfai, Broadlands, Bryntirion).

Saturday, 21 July 2012

Ultra Light Rail - Another transport option?

Ultra Light Rail - Wildly idealistic, or sustainable way to keep open/
re-open lesser used branch lines in Wales?
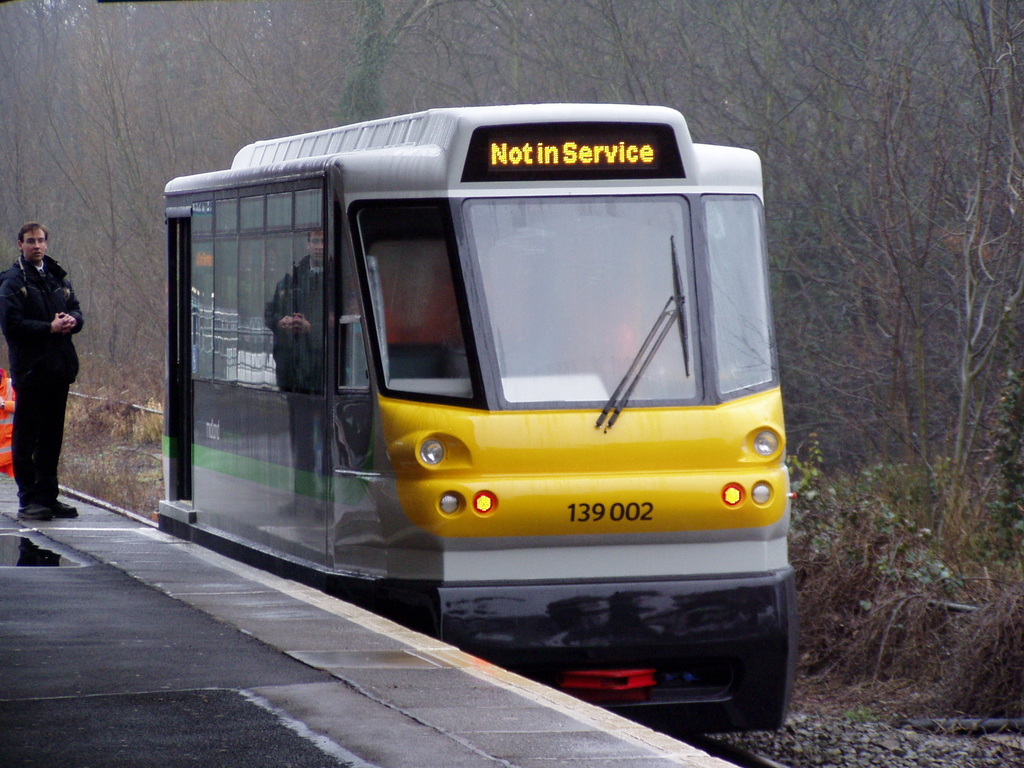
(Pic : Wikipedia)

When you think of "railway", you probably think of the standard heavy rail network between major population centres. You probably won't include trams under the same umbrella, and will write-off the narrow gauge railways as "something for tourists".

Are we too hung up on our railways meeting a certain standard to be categorised as such? Is there an opportunity for Wales to take a different path in the future?

Swiss railways, for example, consists of standard gauge, narrow gauge and tram railways - all part of an interconnected network, with each part serving its own function in its respective community.

What is "Ultra Light Rail"?

The Sustainable Travel Company and Parry People Movers Ltd have carved out niches for themselves by developing a series of lightweight self-propelled "tram trains", dubbed "Ultra Light Rail".

They are designed to run either on their own track (like trams) or even on standard heavy rail. Some of these vehicles are being used on parts of the UK rail network - in Stourbridge for example (photo above). They can even - possibly - be adapted to street-running.

They're designed to carry generally the same number of passengers as a small tram, but not as many as a mainline train or a tram system in a major built up area. It could be considered – in shorthand – a light rail system for rural areas and smaller towns.

Where could Ultra Light Rail (ULR) fit in?

Wales has three different types of railway, as I can see:
  • CoreMainline services (north Wales, south Wales mainline) and heavily-used commuter services (Valley Lines).
  • Branch – Connecting, lesser used and community/rural services (for example Llandudno-Blaenau Ffestiniog, Heart of Wales Line)
  • Mothballed – Freight-only and disused lines that could be reopened (i.e. Pontyclun-Beddau, Aberdare-Hirwaun, Llangefni)

ULR could become a new category for railways – a halfway house between traditional heavy rail and tram-based light rail. To do something like that though would either require the devolution of rail regulatory powers, or independence. It would have its advantages and disadvantages.

For example, ultra light rail could have relaxed regulations for track and station standards, which could help keep maintenance and running costs down – and more crucially help keep some lesser-used branch lines open.

However, that could also be considered a safety risk or lead to poorer standards of service than normal railways.


These could be the main features:
  • Self-propelled vehicles – Fuel cells, flywheels etc. No need for large-scale electrification.
  • Modular stations – Which could consist of a very basic platform, with DDA access wherever necessary.
  • Simpler signalling systems – In some cases perhaps reduced to a simple "stop" or "go", but this would likely mean slower permissible line speeds.
  • Only used on connecting branch railways - To free up space for extra mainline services
  • Street-running adaption – Becoming a more formal "tram train".

How could these systems be run?

Financial viability is a key consideration for any project like this, and for now, none of these are likely to be viable by themselves. However, there are alternatives:
  • Municipal-owned/partnered transport companies – A return to regulated public transport in local authorities/regions, with bus, light rail and ultra light rail services coming under the control of arms-length companies, possibly run on a not-for-profit model.
  • Community rail partnerships – Just like existing schemes, but with some of the functions (track maintenance etc.) being run by volunteers and apprentices.
  • Subsidised through general taxation – Many of the communities that would benefit from this are distant, and fixed transport connections would provide greater social and employment opportunities.
  • Subsidised through hypothecated taxation – Congestion charges, car parking levies, emissions charges, a precept on Council Tax (like a police or fire authority would).
  • Voluntary contribution – For example, retail parks, business parks, voluntarily contributing towards the costs of building stations for/near their premises.

An exemplar ULR network

Like my look at cycling, I've decided to look at a possible ULR network for Bridgend. This isn't a serious proposal, just an example of how it might work. Here's a schematic for a potential ULR system, based on the existing Maesteg branch line, and the disused Garw and Ogwr valley lines.

A theoretical Ultra Light Rail network for Bridgend county -
not to be taken too seriously, just to illustrate the potential.
(Click to enlarge)


This network uses the existing Maesteg branch, extended northwards to Caerau (it would now be impossible to send it through to Cymer and Glyncorrwg, which is a shame), alongside the partially disused Garw branch (currently earmarked for development as a heritage railway), and the completely removed Ogwr valley branch. The Ogwr branch is now a cycle path, but it should be pretty easy to rebuild cycle paths next to the rails, separated by a robust fence, and continuing to encourage cycling and walking.

As a "money no object/not serious" idea, if it were possible, the ULR network could be extended south of Bridgend, momentarily sharing the Vale of Glamorgan line, then swinging outwards, south of Island Farm and Broadlands, before joining the Porthcawl road, and becoming a street-running service into the centre of Porthcawl. The cost and environmental implications of such a thing are likely to be prohibitive - even for wildly idealistic people like myself.

This wouldn't be designed to replace mainline services, just provide a lightweight, low-cost way of feeding into mainline services, as well as maintaining local, lesser-used community railways. If anything, it would supplement = and possibly be an eventual replacement for - existing bus services.

For example, any Bridgend network would free-up space on the South Wales Mainline for additional services in place of the current Cheltenham-Maesteg service. Passengers from the Bridgend Valleys would (ideally) be able to buy through-tickets (or use pre-paid cards, harking back to my post The Welsh Metro last year), changing at Bridgend station.

There are possible other places in Wales this approach could be used:
  • Pontyclun to Beddau (and possibly Ely Valley)
  • Swansea to Onllwyn & Blaengrawch
  • Llandudno to Blaenau Ffestiniog
  • Wrexham to Mold
  • Bangor to Caernarfon

This won't be an ideal solution for every situation, but if it allows greater connectivity between some of our more isolated communities – as it has done for the Swiss – then perhaps it's worth keeping it as an option on the table for the future.