This site is no longer updated

Please use the links in the sidebar to visit the new sites!

Showing posts with label Census 2011. Show all posts

Monday, 10 March 2014

Towards a Cornish Assembly?

Cornish nationalist party, Mebyon Kernow, recently launched a
consultation on the format of Cornish devolution.
(Pic : Western Morning News)
While most of the constitutional focus in Wales has been on Silk II, and constitutional focus across the UK on the Scottish independence referendum, the fifth nation of the UK has thrown its own hat into the ring.

Cornish nationalist party, Mebyon Kernow (MK), launched a consultation document on proposals for a devolved Cornish Assembly on March 5th – St Piran's Day. It's available here (pdf).

Fifty thousand Cornishmen will know the reason why

As I've covered before (The Case for Cornwall), Cornwall meets most of the standard requirements and historical precedents to be considered a nation rather than an English region or county. Back in 2001, more than 50,000 signed a declaration calling for Cornish devolution. It was Liberal Democrat policy, with the closest Cornwall coming to devolution being a backbench Government of Cornwall Bill (pdf) introduced by Dan Rogerson MP (Lib Dem, North Cornwall) in 2009.

As I post this, the Lib Dems have made it official party policy again.

Many of the problems facing Cornwall are very similar to those facing
us in Wales  - especially in terms of economic development
and demographic change.
(Pic : BBC)

With the UK constitution now in flux, MK believes "there needs to be a mature, respectful and wide-ranging debate about the future of the whole of the UK and how it is governed." A constitutional convention then - something our First Minister and others in the National Assembly would no doubt agree with.

If it's agreed that Cornwall should see devolution, and a detailed proposal fleshed out, MK supports holding a referendum.

Many of the challenges facing Cornwall are all to familiar to us in Wales : an ageing population caused, in part, by in-migration of retirees; high house prices in rural areas, a relatively weak economy (Cornish GDP per capita was 61.2% of the UK average in 2012, compared to 72.3% for Wales) and "peripheral neglect" by being so far from Westminster.

Except, of course, Wales, Northern Ireland and Scotland have their own devolved legislatures to deal with some of these issues to varying degrees of success (or failure).

MK believe a Cornish Assembly would "be in a strong position to built a more prosperous economy....support Cornwall's traditional and emerging industries, build on Cornwall's sense of place, it's unique brand, and maritime potential".

Chuckles' "Prince of Wales" title is exactly that - a title and nothing more.
His role in Cornwall, however, is significantly more hands on
- perhaps to Cornwall's detriment.
(Pic : The Telegraph)

The party also believe that Cornwall suffers from a "democratic deficit" as they only have 123 councillors serving a population of 534,000 in a single unitary authority. Devon has two and a half times the population but four times the councillors, while Somerset has 1.7 times the population and 3.5 times the number of councillors.

A National Assembly would also reinforce Cornwall's national status, with 73,200 people describing themselves as Cornish in the 2011 census, despite it not being on the official census form, working out at around 14% of the population. Also, 46% of children in the 2013 school census described themselves as Cornish (more from Cornish Republican).
There's a very specific bone of contention too involving the Windsor clan. Chuck Windsor (and presumably in the short to medium term, Billy Windsor) enjoys near-feudal rights as Duke of Cornwall. MK believe devolution will make it easier to hold a full inquiry into "Cornwall's ambiguous constitutional relationship with the Crown and contradictions between this....and administrative arrangements".


What would a National Assembly of Cornwall look like?

Mebyon Kernow propose something for Cornwall near enough identical
to what we have in Wales, with some key differences - in particular the voting system.
(Pic : cornwallvsf.org)
  • Devolved powers – Effectively the same powers as the Welsh Assembly (agriculture, tourism, health, education, culture, housing, local government etc.) - including primary law-making powers from the start. They also want the power to vary income tax, perhaps in light of what's on the table for Wales and Scotland.
  • The Cornish Assembly – 40 Assembly Members (AMs) elected in multi-member constituencies by Single Transferable Vote (STV). This works out as roughly 1 AM per 13,350 people. The exact arrangements and constituencies will be decided by a special commission. Cornish AMs would sit in committees and work in a similar way to our AMs. Although there's nothing in the proposal about where a Cornish Assembly would be based, you would presume it would be at the existing Cornwall Council buildings in Truro without the need for a new building.
  • Cornish Government – Made up of between 4 and 6 ministers with "a small number of junior ministers". It would be headed by a First Minister along the same lines as the Welsh Government and supported by a civil service.
  • Finance – Cornwall would be funded via a Welsh-style block grant via a needs-based settlement, which MK estimate at being in the region of £4billion. They also want control of EU Structural Funding (Objective One), which Cornwall receives in the same way as West Wales & The Valleys, except it's administered from London and Bristol.
  • Local Government Reorganisation – The single local authority covering Cornwall would be rescinded and replaced with four new councils, each with 35-45 councillors, set out by legislation. These councillors would also be elected by STV. Some decisions could be devolved further down to community and parish councils.
  • External Relations – Cornwall should have representation on the British-Irish Council, and should have its own MEP, with offices in Brussels. Cornwall should also have its own Commonwealth Games team and the Cornish should be protected via the Convention for National Minorities in the same way as the Welsh and Scottish.


Devolution : Go for it, but don't repeat our mistakes

If a Cornish Assembly were formed,  these signs might have
more than a little bit a truth in them for once.
(Pic : libdemvoice.org)
Wales stands testament to the fact that while devolution does bring a means to make sometimes significant policy changes, it doesn't guarantee success, and is far from a "magic bullet" in itself.

Believe it or not, Mebyon Kernow have been "inspired" by some of the achievements of our National Assembly over the past 15 years (and the Scottish Parliament), picking out :

  • Scrapping prescription charges and hospital car parking charges.
  • Protection from the "creeping privatisation of the NHS in England".
  • Statutory waste and recycling targets with an aim of "zero waste".
  • Allowing suspension of "right to buy" in areas facing housing pressures.

So there are plenty of things the Cornish can learn from devolution elsewhere in the UK, but there are also plenty of mistakes they would do well not to repeat. I would pick out mismanagement of EU funds as the biggest lesson Cornwall could learn from Wales, as well as timidity in policy making and having too small a legislature to allow effective criticism of the executive.

Politically-speaking, a Cornish Assembly could throw up some interesting things.

If you want to compare it to Wales, it's likely the Lib Dems and Labour would swap positions, with Cornwall becoming a Lib Dem hegemony and Labour being a minor party that would struggle to get more than 3/4 seats in a 40-seat legislature. It would make the machinations of an STV system interesting for psephologists I suppose – and it's sensible that Mebyon Kernow have proposed that system from the start.

As to how to get in the position of being able to hold a referendum, MK would have to secure their "Gwynfor moment". By that I mean winning, or seriously challenging for, a Westminster seat. Then the party would probably have to become a major force on Cornwall Council, being in a position to form a government or some sort of coalition with the Lib Dems in order to get Cornish devolution on the Westminster agenda.

Saturday, 13 July 2013

Census 2011 : A Changing Bridgend

In this final look at the 2011 census data, I'm going to look at Bridgend down to ward level to see how the county's changed between 2001 and 2011. I've used an ONS data table tool to compile this.

If you have no idea which ward is which, here's a map :
Map of Bridgend Council wards
(Click to enlarge)


Population & Population Density

Change in population 2001-2011
(Click to enlarge)
Population density per ward in 2011
(Click to enlarge)


The population of Bridgend County rose by ~10,500 between 2001 and 2011, from 128,645 to 139,178. Most of that can be accounted to housing developments. Brackla and Cornelly's population rose by over 1,000 each, while in Bryntirion, Laleston & Merthyr Mawr it rose by a whopping 4,417 – almost certainly due to the Broadlands development – and more than doubling the population of the ward (+102% increase).

Brackla remains the most populous ward overall, with a population of 11,749.

Coity will likely see the biggest increase between 2011 and 2021, with the Parc Derwen development likely to add at least 2,500 people.

Not all wards experienced population rises. The Maesteg and Caerau area, Cefn Glas and Litchard/Pendre areas all lost more than 4% of their populations, with Pendre experiencing the sharpest drop of 11.9%, closely followed by Cefn Glas (-11.8%).

Population of major settlements in Bridgend County
  • Bridgend (including Penyfai, Coychurch Lower & Coity wards) : 49,404
  • Bridgend "Urban Area" (including the Aberkenfig/Sarn area & above) : 60,824
  • Maesteg (including Caerau and Llangynwyd) : 20,612
  • Porthcawl : 16,005
  • Pyle/Cornelly : 14,464
  • Pencoed : 10,054
In terms of population density, the second map clearly highlights major settlements. At least 43% of the county live in Bridgend town itself and its immediate surroundings, with Morfa (40.2 people per hectare), Porthcawl West Central (37.8) and Brackla (36.6) being the most densely populated wards, and Blackmill (1.5), Aberkenfig (1.7) and Bryncethin (1.8) the least densely populated.

There's also the prospect, depending on how other towns have changed, that Bridgend is now pushing to be in Wales' top 5 urban areas by population.


Demography

Mean age per ward
(Click to enlarge)
% of the resident population aged 65+
(Click to enlarge)


Porthcawl is a significant pocket of wards with a higher average age compared to the rest of Bridgend county, while the younger wards tend to be the suburbs of Bridgend itself – Brackla (mean age 35.5), Coity (37.9) and Bryntirion, Laleston & Merthyr Mawr (35.1). Bettws also has a younger than average population (36.6).

This could reflect the housing market. Brackla and Broadlands attracting younger families, for example, while Porthcawl and suburbs like Litchard are known to be popular with retirees or older, stable families. It could also reflect reduced average life expectancy in deprived wards north of the M4.

There's a similar pattern reflected in the percentage of residents of pensionable age. Porthcawl is once again way out ahead of the rest of the county in terms of over 65s, with Nottage (30.1%) and Rest Bay (36.6%) having the highest percentage of pensioners in the county, closely followed by Coychurch Lower (35%). Cross reference this with the religion, national identity and limiting illness figures and you'll see a pattern.

Religion

% of the population describing themselves
as "Christian" in 2011
(Click to enlarge)
Change in % of non-religious 2001-2011
(Click to enlarge)


The dominant organised religion in Bridgend is – surprise,surprise – Christianity and its denominations, with 55.1% of people describing themselves as such. The second largest organised religion is Islam. Bridgend had 529 Muslim residents in 2011, or 0.4% of the population. "Other religions" are the third largest group, closely followed by Buddhists and Hindus (0.4, 0.3 & 0.2% of the population respectively). All of these smaller religions saw growth in numbers between 2001 and 2011. 43.7% of people were irreligious or gave no religion.

What's clear is that Christianity is strongest in the Porthcawl and Maesteg areas, and the leafier suburbs and villages surrounding Bridgend (Litchard, Cefn Cribwr, Pen-y-fai and Coychurch). Compare that map with the one for over 65s further up and that perhaps explains why. It also corresponds roughly with where religious-affiliated primary schools are.

In terms of the non religious, there's a uniform rise across the borough, echoing national trends, with a few exceptions – notably Pendre and Coychurch. Pendre has a very committed community church in the ward, and shares its neighbourhood with the Princess of Wales Hospital, becoming a popular  base for Filipino nurses. Filipinos being amongst the world's most devout Catholics, and Bridgend also has a large Polish contingent.

National Identity

% of residents giving some or
exclusive Welsh identity in 2011
(Click to enlarge)
% of residents giving some or exclusive
English national identity in 2011
(Click to enlarge)

There's a very clear north-south split between a strong Welsh identity in the valleys, and a still strong, but weaker, Welsh identity in Bridgend constituency and Pencoed.

The strongest Welsh identity is in the upper Llynfi valley - all wards above 85%. The weakest is in the eastern half of Bridgend – Coity (66.8%), Brackla (68.5%), Coychurch Lower (67.9%) - and Porthcawl.

It almost flips to the exact opposite when it comes to English identity, with stronger English identity south of the M4 – almost exactly mirroring the figures for Welsh identity. However, the English remain a relatively small minority, with only 7 wards having an English population above 10%, with the largest in Coity (14.8%).

British-only identity is weak across the county, with the strongest being in the southern half – in particular Porthcawl (averaging around 18%) - and the weakest north of the M4, with several wards recording single figure levels of "Britishness". The average is around 13.5% per ward.

Place of Birth

% of residents not born in Wales in 2011
(Click to enlarge)
Change in % of residents not born in Wales
2001-2011
(Click to enlarge)

There's another clear north-south split, with more people in the southern half of the county being born outside Wales than the valleys. There's an average of 17% per ward, but it's higher than 20% in 11 wards – all of them in Bridgend town and Porthcawl. The lowest percentages of people born outside Wales are in the Maesteg area, with around 7% in Caerau, Maesteg East & West.

In terms of how it has changed since 2001, there's no clear pattern, but the Bridgend area, Garw Valley and Ogwr Valley have seen the biggest upward change. Nantymoel surprisingly saw the biggest increase at 6.3%, closely followed by Oldcastle (3.8%) and Cefn Glas (3.5%).

Penyfai saw the sharpest fall at -2.7%, with Litchard the next closest at -1.2%. There's a bit of a surprise that Bryntirion, Laleston and Merthyr Mawr has seen a fall (-0.8%), as you would've expected the executive homes in Broadlands to have attracted English migrants in particular. Similarly the Porthcawl area.
Similar to national trends, the raw numbers indicate the increase being mostly down to European Union migration since 2004 enlargement, with the English-born topping it up.


Qualification Levels
% of residents with no qualifications in 2011
(Click to enlarge)
% of residents with at least a degree-level
qualification in 2011
(Click to enlarge)

Another clear north-south split. The big cluster of high numbers of people with no qualifications are the three valleys, with Bettws (48.5%), Caerau (44.5%) and Sarn (39.5%) all possessing exceptionally high levels. The average for wards north of the M4 appears to be in the low 30s, while south of the M4, only Morfa (31.4%) stands out as particularly high.

So there's a clear, indisputable link between poor education and deprivation, illustrated graphically on the map, as the wards with high levels of the unqualified are amongst the most deprived wards in the county.

On the flipside, wards south of the M4 generally have the higher proportions of people holding at least a degree level qualification. The highest in Rest Bay (39.4%), followed by two other Porthcawl wards – Newton (35.4%) and Nottage (34.5%). Bryntirion, Laleston & Merthyr Mawr (36.6%) and Coychurch Lower (30.4%) also had high percentages. This points towards the executive homes in Broadlands being popular with the professional middle classes, and migration of retirees holding degrees.

Most people in Bridgend fell "in between". However, on average in each ward, those with no qualifications (30%) outnumber those with degrees (22.5%). The general trend is a rapid move towards a better qualified population, like the rest of Wales.

Limiting Illnesses

% of population with a limiting
illness in 2011
(Click to enlarge)
Change in % of population with limiting
illnesses 2001-2011
(Click to enlarge)


There's no set pattern across the county in terms of the proportion of people with limiting disabilities (describing themselves as in bad or very bad health). The ward average was 26.2% in 2011. The valleys, Porthcawl and some suburbs of Bridgend appear to be the areas with more disabled or ill compared to the rest.

As to how this has changed, there's a surprise in store. It appears as though the health and well being of people north of the M4 is improving – especially in the Ogwr and Garw valleys (and Cornelly). Ynysawdre saw the sharpest fall of 5%.

However, the health of people in the southern half of the county, especially Bridgend and Porthcawl, appears to be getting worse. This reflects the national trend where "wealthier" areas have seen declines in overall health compared to the stereotyped valleys. Coychurch Lower, for example, saw an 8% rise in limiting illnesses compared to 2001.

When you cross reference this with the age figures you can see that not only are long-standing problems with disabilities apparent, but it also highlights the impact of an ageing population, with "older wards" like Nottage, Newton, Rest Bay and Coychurch Lower having higher percentages of those with limiting illnesses compared to "younger" wards like Brackla.


Welsh speakers

% of over 3s who can speak, read or
write Welsh in 2011
(Click to enlarge)
Change in % of over 3s who can speak,
read or write Welsh 2001-2011
(Click to enlarge)

Bridgend has never really been a hotbed of the Welsh language, being one of the more Anglicised parts of south Wales. However, there are pockets of strong Welsh-speaking ability – in particular the Maesteg area. Llangynwyd had the highest percentage of Welsh speakers aged over 3 in the county at 18.9%. What is a bit of a surprise though is that both Penyfai (15.1%) and Bryncethin (16.7%) also have quite strong figures.

Overall though, Bridgend county remains well below the national average for Welsh speakers, with an average of 13.5% per ward.

Like national figures, the trend has been downwards since 2001. Although Llangynwyd was the only ward with a 20%+ percentage in 2001, there were several other wards in the high teens at the same time. Across the county, the Welsh speaking population fell on average by 2.5% per ward, with sharper declines in  : Coity (-7.4%), Litchard (-4.9%) and Oldcastle (-4.6%).

Only two wards saw a rise – Bryncoch and Bryncethin (both +0.3%). The numbers also held up relatively well in Pencoed and the western half of Bridgend itself – in particular Bryntirion.

Taking the two figures together, it hints that future demand for Welsh medium education is likely to come either from the Ynysawdre/Sarn area, or western Bridgend (Penyfai, Broadlands, Bryntirion).

Thursday, 2 May 2013

Census 2011 : Demographics II - Its meaning for Wales

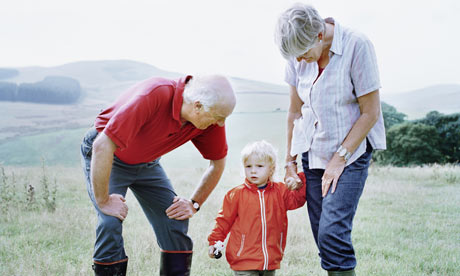
What are the possible consequences of an ageing population?
(Pic : The Guardian)
Firstly, I forgot to include the data I used yesterday (2001, 2011).

Following on from yesterday's post, I'm going to look at some of the possible implications of the demographic/age changes in more detail. But to summarise – for those of you who can't be bothered to sift through the last post:
  • Wales' mean age was 40.6, median 41 – second highest of the regions of EnglandandWales.
  • 18.3% of Wales' population in 2011 was aged 65+ - a rise of 0.9% on 2001 – with much higher levels in rural central and northern Wales.
  • 45.2% of Welsh residents were aged between 30-64 – a fall of 2.3% on 2001.
  • The percentage of school age children fell by 3.4% nationally, but there was no change with regard pre-school children (0-4 y.o.).
  • The percentage of young adults (18-29) rose by 1.8% on 2001, seeing bigger rises in urban areas of Wales, with the notable exception of Ceredigion.

Impact on the Welsh language

Back in January, I posted my musings on the fall in Welsh speakers. I made several guesses as to why that happened.

Firstly, the mortality and migration issues. Y Fro – Anglesey aside - isn't as old as I was expecting. However, all 4 Y Fro counties do have above-average levels of pensioners, and they've also seen some of the biggest increases in pensionable populations since 2001 – again, in particular Anglesey.

When you cross-reference this with the falls in Welsh speakers, I think this will have had an impact in Ceredigion and possibly Carmarthenshire, but less so in Anglesey or Gwynedd. The latter two didn't see as sharp a drop in Welsh-speakers as the southern half of Y Fro. So I think mortality at least – an older population, including a fair chunk of Welsh speakers, dying naturally - is just one small bit player in a complicated set of circumstances.

It's hard to tell whether "elderly migration" had a similar impact. As far I can tell, the figures aren't broken down by age. I suspect it will have, especially if those migrating aren't Welsh-speakers. But as I pointed out then, significant numbers of migrants to Y Fro are from other Welsh local authorities – especially into Ceredigion – while English migration isn't as pronounced compared to European immigration or those from further afield.

When you look at the rise in "young adults" in Ceredigion alone, I was probably right to include the expansion of university education – and an increased in-migration of non Welsh-speaking 18-21 year olds – as a possible factor.

There's clearly a shift towards the young in terms of Welsh speakers overall. But
will falls in  numbers of school age children in Y Fro cause problems when
planning Welsh-medium school  places in the future? As well as impact
the number of Welsh speaker nationally.
(Pic : BBC Wales)

One thing I did say, was that there was cause to be upbeat because of a clear, positive "demographic shift" towards the young in terms of numbers and percentage of Welsh-speakers. Blog Menai has also pointed out that amongst the over-20s, Welsh speakers are on average younger than non-Welsh speakers. However, viewing this in itself as a possible saviour of the Welsh language might be a little over-optimistic.

Ceredigion already had one of the lowest percentages of school age children, and it's quite likely that in 2021, school age children might fall into a single figure percentage of the Ceredigion population. Gwynedd and Anglesey also have fairly "low" percentages of school-age children resident. Although there's a definite demographic "bulge", with Welsh-speakers overall becoming younger, in terms of strength in numbers it's unlikely to make that much of a difference.

There'll be more Welsh-speaking young people (under 30s) in 20-30 years time for sure – perhaps 30%+ of the population even outside Y FroBut they're still going to be outnumbered by pensioners in terms of sheer numbers. Quite a few of them are likely to leave and bring up children elsewhere. So as much as shoring up the heartland is important, it's equally important to meet demand for Welsh-medium education elsewhere in Wales too.

So my guess is the physical number of Welsh speakers will go up nationally. But if that doesn't exceed the pace of general population growth - topped up by non-Welsh speaking elderly migrants - then Welsh speakers as a percentage of the population will stagnate or continue a slow decline  (inside and outside Y Fro) or struggle to breach 20% of the Welsh population.

But it's worth pointing out that demographic projections aren't an exact science and tend to "wobble" quite often.

Impact on the economy

The main factor here is the "productive population" - the numbers of working age people with jobs, generating wealth measured as gross value added (GVA).

GVA is divided amongst the total population to get headline GVA per capita figures. That means pensioners, temporary and long-term unemployed or disabled and school age children are included - not just the "working" working age population.

GVA is rural areas is low anyway. That's perhaps because sectors like agriculture and tourism don't generate as much for the economy as a whole compared to financial services or manufacturing - the latter two generally based in urban areas and city regions.

In parts of Wales with higher numbers of disabled people, pensioners, or higher numbers of those in full-time study too (in the case of Gwynedd and Ceredigion) - the "productive population" is going to be significantly lower than somewhere like Cardiff. Therefore, an already weak GVA is divided by more (statistically) "unproductive" heads, producing weaker GVA per capita figures that it perhaps otherwise should be.

So there's probably a warning that, although GVA is useful in measuring economic strength, it isn't the be all and end all of an economic story on the ground.

Impact on key public services

The main issue here as I see it is the dependency ratio. Dependency ratios measure the relative demographic "burden" placed on an area's working age population by those outside the labour market (children and pensioners). You can have separate child dependency ratios and old dependency ratios too.

The higher the dependency ratio, the more a government has to spend or provide things like education, pensions and social services for children and the elderly. It's fair to point out though that some pensioners might still be in the labour market, and the retirement age is rising to 66 by 2020.

It's calculated to international standards by:
  • The number of full-time school children (defined as 0-15 by international measures) and pensioners (65+) added together
  • Divided by the working age population (15-64)
  • Times by 100
Dependency ratios nationally and in each local authority in 2011
(Click to enlarge)


In Wales, the dependency ratio is at 54.6, compared to 51 for the UK as a whole. That means Wales bares a slightly higher "burden" of dependents than the rest of the UK. We probably knew that anyway.

However, at individual local authority level, some of the figures are jaw-dropping. Five local authorities have a dependency ratio above 60.

Old age dependency ratios are perhaps more important here
, as they're usually out of the workforce permanently and place a greater relative burden on health and personal social services, whilst school-age children will eventually join the workforce.

Some Welsh local authorities currently have levels of old age dependency that the UK as a whole isn't expecting to see until the 2050s! (30-40) And all of them are in the "West Wales & The Valleys" EU region. Remember what I said about GVA figures earlier. Is it any wonder why the Welsh economy struggles if these are the sorts of numbers bandied about?

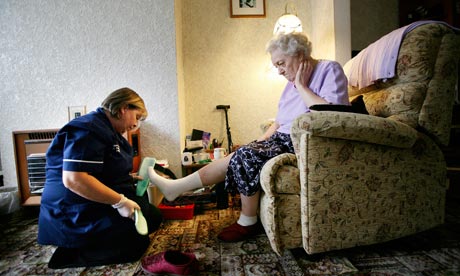
With the old age dependency ratio in Wales increasing, who's
going to pay for all the extra elderly in the future? Will people
my age have to work for significantly longer than current pensioners?
(Pic : The Guardian)
Wales, as a whole, has an old age dependency ratio of 28.4. So there's roughly 3 working age people for every 1 pensioner. In some Welsh authorities, it's already lower than that that.

That doesn't necessarily mean there'll be strain on things like social services and health, as long as people have a long healthy life expectancy so they don't need to rely on those things in the first place.

If we don't live healthier lives in old age, then it'll t means we'll need to consider immigration of 16-40 year olds to work, pay tax and support pensioners; as well as a higher birth rate – especially in rural Wales - to provide more sustainable levels of working age people down the line.

It's also significantly more expensive to provide services in sparsely-populated rural areas than urban areas for a whole host of reasons. It will probably be better (for the state) for the elderly to live somewhere like Cardiff compared to Conwy. But peace and quiet is something retired people might want. We either need to either quietly discourage that, or come up with ways to live with it.

When you factor in things like a higher relative percentage of working age people with disabilities too – who aren't counted as dependents, but who don't work - there are still major challenges facing parts of Wales.

Impact on politics

It's unclear. The number of pensioners hasn't massively changed nationally since 2001, but in individual constituencies and regions, the numbers of pensioners could have an impact on politics locally.

It's anecdotal evidence, but older people are generally more conservative, more eurosceptic and in Y Fro neither likely or unlikely to speak Welsh as well as being cultural nationalists (both Welsh and "British"). They also turn out more at election time.

Another thing that the figures highlight is that 40-70 year olds are too dominant in politics at all levels in Wales. Maybe that's for good reason, because people want to elect someone with "life experience". Perhaps now you can see why those aged under 30 are switching off from politics altogether, or more interested in taking up single-issue causes/activism as opposed to institutions like local councils, the Assembly Westminster and the European Parliament.

There's a massive risk of creating a generation gap in Welsh politics that will be hard to close because young people will never become interested in mainstream party politics in the first place. It's entirely plausible that political parties in Wales will struggle to recruit new members and candidates in the long-term, because politics has effectively turned its back on an entire generation.

There are numerous examples proving younger people can be elected to office at all levels. But having one or two "token" young politicians in local government, or putting them in the ghetto of student/"yoof" politics, doesn't cut it if politics wants to be representative.

For example, based on the census figures, the Assembly should currently have at least 9 AMs aged between 18-29 and 10-11AMs aged over 65. Though they're not far off the latter, they fall way, way short of the former.


Unfortunate implications in The Valleys

The general "youth" in the valleys could be down to at least two factors.

The first one is shorter life expectancies than the rest of Wales, dragging average ages – especially means – downwards.

The second one could be a result of people having children younger, including teenage pregnancies. This means that the percentages of young adults and school age children are boosted, as there would have been more young adults and 15-16 year olds having children than the Welsh average over the census period – though the numbers of teenage pregnancies are falling.

Now, teenage pregnancies aren't a "good thing". However, in the long-term it could help keep old age dependency ratios in the Valleys at a more sustainable level, but that'll only work if the economy improves. Those kids being born to younger parents will need to be well brought up, well-educated and have decent jobs waiting for them when they're older.

How can we keep Wales "young"?


I don't know what a "good" old age dependency ratio would be, but I'd guess we should aim to get it down towards 20% nationally, allowing a bit of variation between local authorities.


First and foremost – boost the birth rate. However, it's nowhere near as easy as that, as having children is dependent on a whole host of other things.

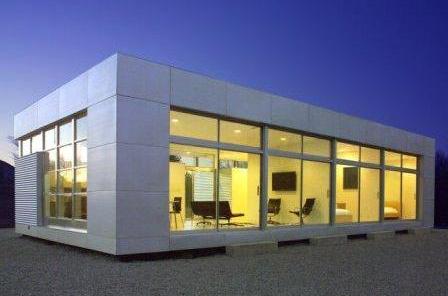
Do we need to place less emphasis on owning property
as an investment? Do we need to come up with ways to build homes
cheaply and retain younger families?
(Pic : prefabs.com)

There's the issues of housing and housing costs in general. We should probably not place as much emphasis on homes as an investment, as well as encouraging long-term renting and perhaps see a sustained, managed decline in house prices. One way to do that would be to increase supply, and I've covered that before. We need to build more starter homes, and those homes have to be affordable, perhaps using innovative methods of construction.


Next, there's the question of tackling under-employment. We need better paid and higher-value added jobs, particularly in rural parts of Wales, to prevent young adults and those in their 30s-40s from migrating away, leaving only the old - a ticking time bomb with regard key public services. Expanding apprenticeships and providing large numbers of low-paying, low-skilled jobs is fine as a stop gap, but there needs to be something better too, so young families can actually establish themselves.

Retaining graduates – especially home grown ones - once they've graduated is linked to the above. It doesn't seem to be too much of a problem in places like Cardiff. However, if you stem the "brain drain" across Wales, it might convince employers and companies that they can set up higher-value added enterprises, which means better jobs, more money in the local economy and hopefully, eventually lead to more children.

How does Wales retain graduates from Welsh universities?
More importantly, how do we convince employers that we have
the right skill set in the first place?
(Pic : BBC Wales)
New communities designed from the outset to be family-friendly, as well as family-friendly working practises, would also go some way as to encourage a higher birth rate. The valleys, from an objective perspective, are in many cases ideal to bring up young children. We should make more of that, but that means getting to grips with some of the long-standing problems too. That'll mean a lot more than third sector "projects" and housing renewals.

I also mentioned earlier "positive discouragement" with regard elderly people moving to rural Wales, and instead moving to urban parts of Wales to spread the older population out a bit more. By "positive discouragement" I mean doing things that might benefit a rural community as a whole, but put people off "seeking peace and quiet" : windfarms and energy projects, black metal festivals next to nursing homes, active agriculture (with all the noise and smells), planned expansion of larger rural towns, dogging, business parks, road improvements etc.

Wednesday, 1 May 2013

Census 2011 : Demographics I - How old is Wales?

Is Wales getting older? Are parts of Wales getting younger even?
It's a mixed bag. The 2011 census throws up surprises
and not-so big surprises.
(Pic : The Guardian)


Next stop on the 2011 "census tour", and it's one of the big ones. Only two more areas to go after this. Is Wales getting older? What implications will changing age demographics have on Welsh public services? And how does all this fit in with previous posts – like those on the Welsh language and disability?

I'm not going to bother breaking these figures down by gender, as that would complicate things further. You'll all know that women live longer on average than men anyway.

The Welsh Age Profile


In 2011, the mean age in Wales was 40.6, which isn't too different from the median age (41). So people aged 41 in Wales are at the "half way point" in terms of age if you split the population into two equal groups. I couldn't find any similar figures for 2001, so I can't tell how this has changed, but I suspect it's slightly upwards. You'll probably agree once you've read the rest of this.

Wales is slightly older than England (mean 39.3, median 39) and the only English region older than Wales was the South West of England (mean 41.6, median 42). In Cornwall, the figures were a mean of 43.3 and a median of 45.

The median age of the resident population in 2011
(Click to enlarge)
Within Wales, there are very big variations between individual local authorities.


Cardiff is significantly "younger" than the rest of Wales, with a median age of 33. Swansea (39) and Newport (38) are distant third and second places. The south Wales valleys are generally around the Welsh average, with the median age ranging between 40-42.

Conwy is the "oldest" county in Wales, with a median age of 46 and the highest mean of 44.6. Powys (median 46, mean 43.9), Anglesey (median 45, mean 43.4) and Monmouthshire
(median 45, mean 43) closely follow .

In Y Fro, somewhat surprisingly, Gwynedd (median 42, mean 41.6) and Ceredigion (median 42, mean 41.7) are not really that different from the Welsh average. I would've expected Ceredigion at least to be "older", but that's probably the impact of the universities dragging the averages down. If you removed students from those two counties, then I suspect Y Fro would probably be significantly "older" on average than the figures suggest.

The Retired and Elderly (Aged 65+)

In 2011, 18.3% of the Welsh population were aged 65 or over. What will perhaps surprise you, is that it's only risen by 0.9% between 2001 and 2011. Although it's still 1 in 5 of the population near enough, I was expecting higher.


Resident population aged 65+ in 2011
(Click to enlarge)

Once again, there are differences between Welsh local authorities. Cardiff has significantly fewer pensioners than any other part of Wales (13.2%). Newport, the Gwent Valleys and Merthyr Tydfil are a cluster of local authorities with fewer pensioners too, ranging between 16-17% of the population. The likes of Bridgend and Swansea (both 17.9%) follow close behind.

In the north and west though, there's clearly a much greyer population, but we probably already knew that anyway. Conwy is way out ahead of everywhere else with nearly a quarter of the population (24.4%) aged 65+. Powys (22.8), Anglesey (22.4%) and Pembrokeshire (21.8%) come closest to that. What is noticeable though is that Wrexham (17%) and Flintshire (17.6%) have South Walian low levels of pensioners.

In terms of how things have changed compared to 2001, Anglesey has seen by far and away the sharpest increase in pensioners (+3.5%), closely followed by Powys (+2.9%) and Monmouthshire (+2.8%).

What is a little surprising is that – Anglesey aside - things haven't changed very much in north Wales. It's mid and west Wales (and Monmouthshire) which is seeing a big greying of the population.


Change in the percentage of residents
aged 65+ between 2001-2011
(Click to enlarge)

You could even say that south Wales - and that's where most people live, especially Cardiff and Swansea - might not have aged as quickly as the government and local authorities are concerned about.

In terms of specific age groups, although the numbers of 60-74 year olds increased nationally by around 2.1% compared to 2001, there's a drop off at ages 75-84, presumably because that's the age group where most people die naturally.

2.4% of the population of Wales were aged 85+ in 2011 - a rise overall of 0.4% on 2001. Living that long probably comes down to luck and genetics – including the length of your telomeres if you want to get technical - as there's no set pattern across Wales. Torfaen, for example, has seen the same percentage growth of 85-89 year olds as Ceredigion (+0.5%).

Children & Young Adults

Some 45.2% of the Welsh population are "adults", which I'm defining as aged between 30-64. However, the number of 30-45 year olds fell by 2.3% between 2001 and 2011 – the sharpest fall of any census age group – and there were noticeably sharper falls in rural local authorities like Powys, Monmouthshire and Ceredigion.

For the sake of brevity (stop laughing), I'm not going to look into that. What I am going to look at though are younger age groups, namely school age children (5-17) and young adults (18-29). The young adult group will be particularly interesting for economic, cultural and demographic reasons.

School age children

Overall, while the percentage of pre-school children (aged 0-4) hasn't changed at all nationally from 2001, the percentage of school age children fell by 3.4%. Carmarthenshire aside, it's Y Fro counties that have the lowest percentages. Ceredigion had the lowest at 11.4%, followed by Anglesey and Gwynedd (both 12.8%).

Resident population aged between
5-17 in 2011
(Click to enlarge)


Change in resident population aged
between 5-17 (2001-2011)
(Click to enlarge)

Somewhat surprisingly, Cardiff (12.9% ) and Swansea (13%) also had lower than average school age populations. That's probably a distortion caused by a larger number of people overall.

The Gwent area and the Vale of Glamorgan had the highest school age populations, with Newport having the highest percentage nationally at 15.1%. Many of the south Wales valley authorities also had above average numbers of children.


In terms of how it's changed, it's a fairly uniform fall across Wales. Most local authorities saw a fall of around 3-4% in their school age populations, with the joint sharpest falls in Merthyr Tydfil and Blaenau Gwent (-4.7%).


In Y Fro, although the falls in the school age population aren't that different to the rest of the country, because of smaller total populations in authorities like Anglesey and Ceredigion, the effect of the "loss of the young" will likely be amplified much more than in the urban south or north east.

Young adults

The number of young adults on the other hand has increased compared to 2001 – a national rise of 1.8%. 15.8% of the Welsh population were aged between 18 and 29 in 2011.


Cardiff (24.1%) and Swansea (18.4%) – as you might expect – had some of the highest percentages of young adult residents. What was a little surprising is that Ceredigion had the second highest nationally at 21.2%. I think the reason for that's obvious – Aberystwyth & Trinity St David's Universities. Gwynedd also had a relatively high number of young adults at 16.8% of the population.

Percentage of the resident population
aged between 18-29 in 2011
(Click to enlarge)
Change in resident population aged 18-29
between 2001-2011
(Click to enlarge)


In terms of low levels, you've got to point to rural areas of Wales like Powys (11.4%), Anglesey (12.4%), Pembrokeshire (12.6%) and the lowest in Monmouthshire (11%). All of those authorities also lack a university, it's worth pointing out.

In terms of how these numbers have changed on 2001, what's fairly obvious is that Cardiff is by some way acting as a youth magnet with a gain of 4.1%, followed by Newport (+3.1%) and Ceredigion once again (+3.1%). Merthyr Tydfil also saw a big rise of (3.1%). Is that a hint that young adults priced out of Cardiff might be moving north? Or is it just a natural demographic shift?

Some local authorities though had fairly low levels of growth. Flintshire almost flat lines at +0.2% , similarly many north Wales authorities, with the exception of Gwynedd (+1.9%).


Other southern local authorities you would've expected to see sharper growth didn't. Bridgend's young adult population only grew by 1.1%, as did Neath Port Talbot. While Rhondda Cynon Taf only saw a 1% increase.

Because there's so much here that needs to be looked into, this post has been split. The second part will be posted tomorrow and will revisit some other things – like the Welsh language – as well as what all this could mean for the Welsh economy, politics and public services.

Thursday, 18 April 2013

Census 2011 : Qualifications

Not "fik" at all by the looks of it.
Judging by 2011 census data, Wales is - on the whole -
rather well-qualified, but divided between three large "camps".
(Pic : Swansea University)

It's time for another look at the 2011 census data, this time the highest level of qualifications held by  the Welsh working age population (16-65 year olds).

There are three broad categories as I see it : those with degree-level qualifications, those with no qualifications, and everyone else in between (without degrees, but with school-leaver, further education and technical qualifications like apprenticeships).

Degree Level (Level 4) Qualifications

Level 4 qualifications include bachelor's degrees and higher education certificates. A chunk of people holding these qualifications will probably also possess higher (Level 5,6,7+) qualifications like master's degrees or doctorates too.

Percentage of the working age population
with a degree-level qualification in 2011.
(Click to enlarge)
First, it's worth looking at the overall distribution of higher level qualifications in Wales. In 2011, an average 24% of the working age population in each local authority held a minimum of a degree level qualification. That compares to a local authority average of just 17% in 2001 – a 7% rise in the space of 10 years. That's could be down to a rapid expansion in university education during the Blair years.


In terms of patterns, the first thing to note is that the M4 corridor generally has a higher number of level 4 qualification holders than the rest of Wales. Monmouthshire (33.1%), Cardiff (32.3%) and the Vale of Glamorgan (29.8%) had the highest percentages overall. What also stands out is that rural parts of Wales, in general, tend to be home to above-average numbers of degree level qualification holders.

In terms of low numbers, the south Wales valleys have the overall lowest rates. Blaenau Gwent has the lowest percentage at 15.7%, with Merthyr Tydfil (17.8%), Caerphilly (18.7%) and Neath Port Talbot (18.8%) not far behind.

Change in the percentage of the population
with a degree-level qualification 2001-2011
(Click to enlarge)

What was a little surprising though is that north east Wales also had low numbers of level 4 qualification holders compared to the Welsh average. You wouldn't have expected that when you think of the number of manufacturing companies based there, however there could be an explanation for this. I'll come back to that later.


Next, it's worth looking at how things have changed compared to 2001. There were sharp rises in the number of Level 4 qualification holders across Wales, with some of the fastest rises in unsuspecting areas – Anglesey (+8.1%), Vale of Glamorgan (+8.7%), Monmouthshire (+8.7%) and Conwy (+7.9%).

The lowest rise was still a rather creditable 5.9% in Neath Port Talbot, with all Welsh local authorities seeing an average rise of between 6-7% compared to 2001 – even in the Valleys.

No Qualifications


Next, it's time to look at the working age population saying they didn't hold any qualifications.


Percentage of the working age
population with no qualifications in 2011.
(Click to enlarge)
In 2011, just under 26% of the Welsh working age population possessed no qualifications, with a local authority average/mean of 26.3%. This is another big change from 2001, when the local authority average was a whopping 33.3%. So the number of unqualified individuals has fallen by at least 7% nationally in the last ten years.


With the exception of Ceredigion (19.8% unqualified), it's mostly a reverse of degree level figures. Cardiff and the M4 corridor generally has fewer unqualified working age people than the rest of Wales. It's also worth pointing out that north east Wales makes up for its relative lack of higher-qualified individuals by having fewer unqualified residents – in particular Flintshire (23.5%).

The south Wales valleys authorities generally have higher unqualified populations than the urban and rural authorities. The highest percentage was in Blaenau Gwent (36%), with Merthyr Tydfil (34.8%), Rhondda Cynon Taf (31.8%) and Caerphilly (31.4%) not far behind.

Change in the percentage of working age people
with no qualifications 2001-2011.
(Click to enlarge)

But it's not all doom and gloom, especially when you look at how the numbers have changed over the last ten years.


The sharpest drops in unqualified people have been in those south Wales valleys authorities, similar to how they saw the sharpest drops in disabled people too. Some of these falls have been quite dramatic. 9.6% fall in Merthyr Tydfil, 9% in Blaenau Gwent, 8.1% in both Neath Port Talbot and Bridgend, 8.7% in RCT and 8.4% in Caerphilly.

It's actually the "better off" areas that have stagnated here (Vale of Glamorgan, Monmouthshire etc.) – if you call call "mere" 5-6% falls in unqualified people stagnation.

So overall, the situation with regard unqualified people – whilst remaining a challenge in post-industrial Wales – has improved significantly since 2001.

Those in between

The majority of working age people in Wales either have no qualifications, or degree-level qualifications – a total of 50.5% of the population fall into either one of those categories. But what about everyone else?

There's level 1 (GCSE D-G passes), level 2 (GCSE A*-C) and level 3 (A-Level) qualification holders, as well as those with technical qualifications and apprenticeships.

Those with apprenticeships were counted for the first time in 2011 as a separate category. They probably fell under the "other qualifications" category in 2001.

3.9% of the Welsh working age population had apprenticeship training in 2011
, with the highest levels in Neath Port Talbot (5.1%), Flintshire (4.9%) and Anglesey (4.7%). Cardiff had the lowest (2.8%), while the south Wales valleys authorities were generally similar to the Welsh average/total (3-4%).

Those with "other qualifications" (presumably including apprenticeships in 2001) have only increased by 1% on average per local authority since 2001 – the biggest rises were in Cardiff (2%), Flintshire (1.9%) and Wrexham (1.8%).


Moves to create more apprenticeships have only happened in the last few years. But this might explain why the NE of Wales has lower than average numbers of degree-level qualified individuals. Apprenticeships and technical training might be more attractive and useful in terms of jobs and major employers in the area - like Airbus - compared to a degree. Similarly Neath Port Talbot and the steelworks.


There's been a shift from GCSEs (levels 1 & 2) towards A-Levels
and other further education qualifications (level 3) over the last ten years.
(Pic : BBC Wales)

Another bit of good news is that there's been a shift in numbers of people with level 1 and 2 qualifications to level 3. Overall, the numbers of people holding a maximum of a level 1 qualification (GCSE G-D equivalent) fell by 2% on 2001, whilst it fell by 4% at level 2 (GCSE A*-C equivalent). The sharpest falls here have been in rural Wales, with the south Wales valleys lagging behind slightly.

Those with level 3 (A-Level or equivalent) qualifications have risen by an average of 5.3% per local authority since 2001. Here, the valleys have seen some of the sharpest rises, like Merthyr (5.5%), Neath Port Talbot (5.8%), Caerphilly (6%) and Torfaen (6%).

This perhaps shows that the Welsh population is becoming better qualified below degree level, with people staying in education longer and getting further education qualifications as a result – especially in the valleys. The problem is trying to break into that hardcore 25-30% with no qualifications.

What can we learn from this?


Wales is better qualified now than in 2001
– This is the obvious one. Not only do more people hold qualifications, but the quality/level of those qualifications has improved too. The only issue is that it's unclear what academic subjects or technical areas those qualifications are in. They could be in subjects that aren't "economically relevant" one way or another. Though personally speaking, I'd rather people were learning for learning's sake – regardless of what subject that is.

Another big turnaround in The Valleys
– Like the disability figures - where health has improved - there's been a dramatic change (downwards) in the levels of unqualified and (upwards) in the levels highly qualified individuals in the valleys. This could be another legacy of post-industrialisation.


Traditional heavy industries were largely categorised as "unskilled jobs" with no formal qualifications required to work in them. The economy's changed since, so I wouldn't be surprised if the higher levels of non-qualified people in the valleys are another hangover of the age of coal, iron and steel. As these people move into retirement age – and out of "working age" figures – I'd guess the numbers of unqualified people will continue to fall.
The changing nature of qualifications – It's unfair to say that all those with no qualifications aren't skilled. In many so-called "unskilled" jobs, one wrong move and you're dead. Before qualifications became more formalised, people working in farming, heavy industries and manufacturing will have had some sort of formal training, but wouldn't have had a piece of paper to signify that.

That could've been based on an optimistic notion that they would be there for life so wouldn't need transferable skills to take with them to another employer. Those types of training – especially in more technical areas like mine engineering or steel working - would probably be the equivalent to present NVQ standard (level 2 or 3). So levels of skilled workers aged 50-65 in post industrial EnglandandWales might be under-estimated slightly.

Wales has a competitive number of highly educated individuals
- Although in terms of level 4 qualification holders Wales still lags behind the EnglandandWales average of 27.2% (dragged upwards by London and SE England), Wales (24.5%) compares favorably to English regions like:
  • NE England (22.2%)
  • NW England (24.4%)
  • Yorks & Humber (23.3%)
  • West Midlands (23.3%)
  • East Midlands (23.6%)
Wales outperforms several English regions in terms of numbers
of degree-level qualification holders, and some parts of Wales
  perform similarly to Greater London. Why are we still lagging
behind economically then?
(Pic :The Guardian)
Was I right to include this as an economic advantage last year? There are pockets within Wales – especially Cardiff – that are very competitive even with Greater London.

Wales has an uncompetitive number of individuals with no qualifications – Here's the bad news. Although Wales might be doing well in terms of degree level qualification holders, we're not doing so well at EnglandandWales level in terms of of people holding no qualifications. At 25.9%, Wales has one of the highest percentages of working age people with no qualifications, only topped by the North East (26.5%) and West Midlands (26.6%). Some Welsh local authorities are towards the top of the table individually, doing much worse than individual English local authorities. Though once again, it's worth pointing out that things have improved overall.

No distinct correlation between qualification levels and the economy – Having large numbers of people with degree-level qualifications doesn't appear to result in any significant increase in economic output. Rural parts of Wales have large percentages of well-qualified individuals, yet it still lags behind in terms of economic productivity - as pointed out by both myself last year, and Syniadau more recently.

With better qualifications - and the investment put into attaining them -
comes an expectation of better paid, better jobs overall.
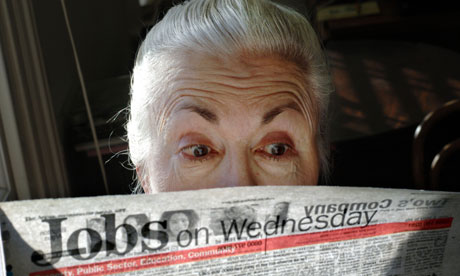
Does Wales have enough graduate jobs to match demand?
(Pic : University of Kent)
It's probably reasonable to suggest that having large numbers of highly-qualified individuals only boosts the economy in major urban centres. So it's linked, perhaps, to urbanisation and "city regions" rather than just a simple case of mass producing people with degrees and hoping that would boost economic performance itself. There's likely to be significant mass underemployment in Wales based on these figures, and it's little wonder Wales keeps draining graduates if that's true.


Professionalisation of vocational (public sector) roles? - It's worth trying to put degree-level qualifications in some perspective. Nursing, for example, was once a largely vocational role but it's now a requirement to hold a nursing degree to practice. Wales employs a larger proportion of people in health services, therefore it's reasonable to assume that changes like this will have contributed to an increase in the number of people with degrees. That's all well and good, but we need people with degrees in areas like science, engineering and maths too – as well as skilled apprentices - working in both private and public sectors.

Unclear impact of learning disabilities – Are those with no qualifications a hidden epidemic of learning disabilities?
Some of the people with no qualifications could also have conditions that cause learning difficulties, like Down syndrome. Conditions like dyslexia and dyspraxia will affect a person's ability to attain higher level qualifications, or even general qualifications, through no fault of themselves.